Geoscience Reference
In-Depth Information
(a)
(b)
16
16
12
12
8
8
Increasing
u
*
4
4
0
0
z
0
z
0
Height above surface Log
z
Height above surface Log
z
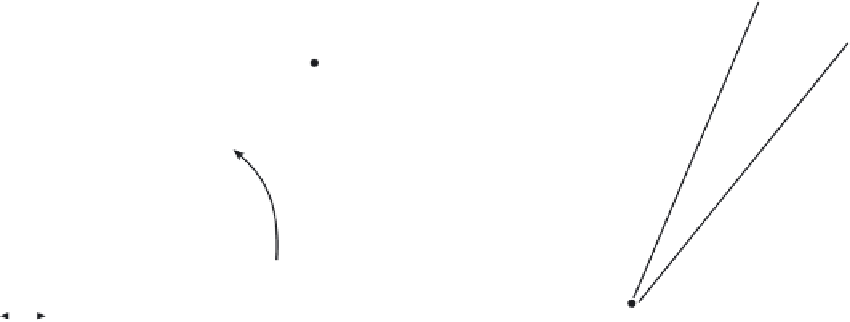
Figure 18.2
Semi-logarithmic velocity profiles showing a focus at height
z
0
, the aerodynamic roughness. The aerodynamic
roughness in (a) is less than that in (b); hence shear velocities (
u
∗
) in (b) are greater. See text for details.
proportional to the velocity profile gradient (Figure 18.2)
and is related to the actual surface shear stress (
otherwise known as the 'law-of-the-wall':
τ
0
)bythe
u
u
∗
1
κ
ln
(
z
−
d
)
following expression:
=
(18.3)
z
0
u
∗
=
τ
0
/ρ
(18.2)
where
κ
=
von Karman's constant (
≈
0.4)
In Figure 18.2(a) the semi-logarithmic turbulent velocity
profile does not reach the surface. This is because very
close to the surface the wind velocity is zero. The height
of this zero-velocity region is termed the
aerodynamic
roughness length
(
z
0
) and it is an important parameter for
it is a function of the surface roughness, it has an im-
pact on surface erodibility and it partly controls the gra-
dient of the velocity profile and hence
u
∗
. For example,
over a rougher surface (Figure 18.2(b)), the aerodynamic
roughnesss (
z
0
) is larger, and with all other parameters
remaining constant, the velocity profile gradient becomes
steeper. Hence, shear velocities (
u
∗
) increase and, conse-
quent upon this, sediment transport would be likely to rise.
Another way in which shear velocity (
u
∗
) might increase
is by a rise in the overall environmental wind velocity, as
shown in Figure 18.2(a). Note in Figure 18.2 that height
is the independent variable and is therefore plotted on the
x
axis of the graph. This is important when calculating
shear velocities using a least squares regression technique
(as described below).
The relationship between aerodynamic roughness (
z
0
),
shear velocity (
u
∗
) and wind velocity (
u
) at a height (
z
)are
d
=
zero-plane displacement
The
zero-plane displacement
(
d
) is a measure of the ver-
tical displacement of
z
0
on surfaces with large surface
roughnesses (e.g. long grass or bushes). It can largely be
ignored on smooth and unvegetated desert surfaces.
18.2.2
Measuring shear velocity (u
∗
)
and wind stress
Shear velocity (
u
∗
) is commonly determined from least
squares regression analysis of time-averaged veloc-
ity measurements at several known heights. Wilkinson
(1983/1984) reports that at least five velocity data points
are required to determine
u
∗
and
z
0
with any statistical
significance and so equipment arrays such as that shown
in Figure 18.3 are typically erected. When plotted in the
manner of Figure 18.2,
u
∗
can be determined from the
slope component of the regression equation by