Geoscience Reference
In-Depth Information
Burial Dose
Geological dose
(10
1-6
yrs)
Bleaching event
(10
2-4
secs)
Laboratory measurement
1
5
4
5
2
Equivalent
Dose
(incompletely
bleached
sediment)
Equivalent
Dose
3
1 : Erosion of sediment
2 : Transportation of sediment
3 : Re-deposition of sediment
4 : Laboratory signal measurement
5 : Interpolation on to laboratory administered dose response curve
Dose (Gy)
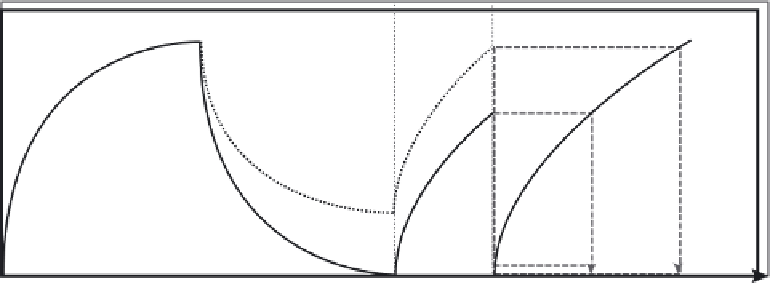
Figure 17.14
Principles of the accumulation of a luminescence signal in sediment and the effect of incomplete bleaching
on determining an accurate estimate of the burial age (adapted from Bailey and Arnold, 2006). Quartz or feldspar grains
deposited by the wind or another geomorphic process, once buried, begin to accumulate electrons at imperfections within
the crystal structure. Over time, an accumulated dose (trapped charge population) builds up. If exposed to sunlight, these
electrons are removed and the dosimetric clock is reset. Laboratory measurements of the trapped electron population allow
an estimate of the radiation dose received during burial to be made. If the resetting process is incomplete (dashed line), a
fraction of the geological dose will remain and the measured trapped charge population will equate to part of the geological
dose plus the burial dose. Without recognition, this results in an overestimate of the sediment burial age (refer to text and
Table 17.6 for details).
An age is therefore determined by
D
e
(Gy) (total absorbed radiation dose)
D
(Gyka) (radiation dose rate)
Age (ka)
=
Luminescence dating procedures are mineral- and site-specific and may be affected by a number of potential
difficulties, some of which are detailed in Table 17.6.
Sallie L. Burrough
Luminescence dating of sand seas has shown that many
have histories of multiple phases of accumulation. Where
multiple generations of dune forms overlap within a sand
sea, e.g. in Mauritania (Lancaster
et al.
, 2002, see Chap-
ter 19, Box 19.1, for a detailed consideration of this dune
system) and the eastern Sahara (Bubenzer and Bolten,
2008), ages can appear to suggest that each dune pat-
tern represents a single phase of accumulation, when sub-
tle differences in atmospheric circulation led to different
pattern orientations. In other contexts, more complex re-
are not linked to specific morphological expressions; i.e
down-profile age changes occur within dunes, sometimes
separated by weak palaeosols (e.g. Fitzsimmons
et al.
,
2007), which identify periods of dune accumulation at
73-66, 35-32, 22-18 and 14-10 ka in the Strzlecki Desert,
Central Australia.
In other sand seas, as the number of direct age deter-
minations from dune sand has increased, so the interpre-
tation of sand sea development has become more com-
plex. Initial accumulation phase histories for the Kalahari