Geoscience Reference
In-Depth Information
A
A
A
`
A
`
(a) Gypsum
(b) Halite
A
A
A
`
A
`
(c) Vegetation
(d) Shade/Moisture
Bare rock
Alluvial Fan
A
Saline Mudflat
A
`
Playa margin
Spring
(ain)
Saline Pan
Dominant wind
direction
Gypsiferous
Aeolian sediments
Green
vegetation
Bare rock
(e) Clastic Sediment
(f) Process Domains
(h)
1.54 km
3.09 km
2.64 km
(g)
A
A
`
Seepage
zone
Alluvial fan
Playa Margin
Saline Mudflat
Saline Pan
256
70.0
Halite
52.5
192
Clastic (alluvial/colluvial)
128
Moisture
35.0
Gypsum
64
17.5
N
0
0
0
93
186
279
372
Pixels along Transect
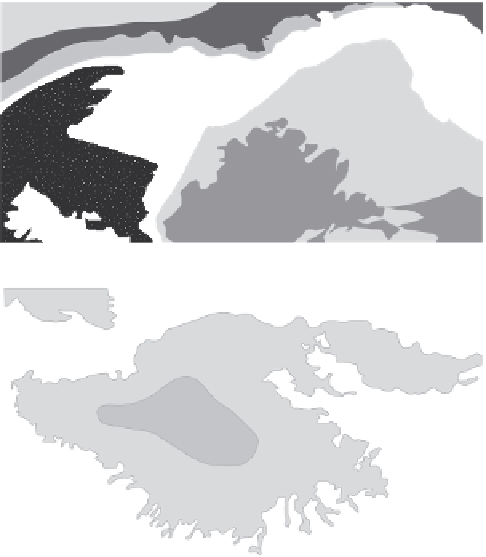
Figure 15.13
An example of the use of remote sensing for mapping and monitoring playa surfaces. In this instance, Landsat
TM data of the Chott el Djerid have been processed to produce maps of the surface concentrations of: (a) gypsum, (b) halite,
(c) vegetation, (d) moisture/shade and (e) clastic sediments. These data are summarised in a map of process domains (f). A
graph cross-section (A-A' c. 20 km) through these data (g) show how data for these surfaces can be used to delineate and
better understand the relationships that exist between the playa depositional subenvironments outlined in Figure 15.4. A location
diagram is provided (h).