Geoscience Reference
In-Depth Information
(a)
15
25
10
30
19/07/02; Qp = 0.3 m
3
s
-1
5
1
10/08/00; Qp = 0.3 m
3
s
-1
26/07/02; Qp = 0.56 m
3
s
-1
Flow
04/08/02; Qp = 1.23 m
3
s
-1
(b)
1
0.1
0.01
0.001
1
10
100
1000
Unit stream power, W m
-2
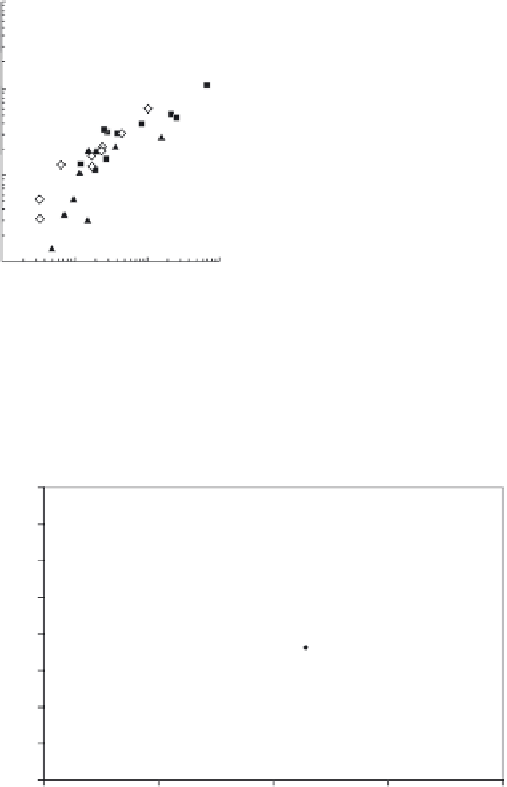
Figure 13.19
(a) Isopleths of scour along a reach of a sand-bed, headwater tributary of Walnut Gulch, southern Arizona, during
four flash floods of varying magnitude showing pseudo-regularity of maximum scour with a downstream spacing of about seven
times the channel width (after Powell
et al
., 2006). (b) Specific scour volume as a function of unit stream power for reaches of
three headwater channels of Walnut Gulch. The least-squares curve refers to bivariates where specific scour volume
≥
0.1 m
3
/m
2
(after Powell
et al.
, 2007).
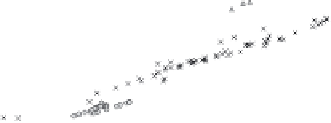
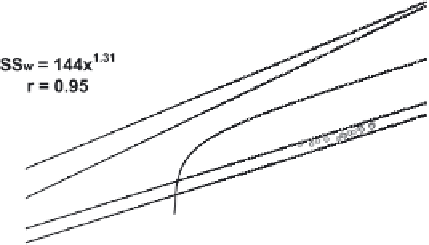
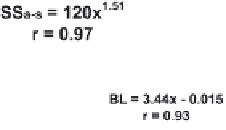
Figure 13.20
Specific flux of suspended sediment (SS) load, dissolved load (DL) and bedload (BL) as a function of contemporary
specific water discharge in the Nahal Eshtemoa, northern Negev, Israel. Subscripts: a-s, autumn-spring; w, winter; f, first event of
rain season; nf, nonfirst events of rain season (after Alexandrov
et al
., 2009).