Geoscience Reference
In-Depth Information
(a)
1.0
0.5
0
-0.5
-1.0
1.0
0.5
0
-0.5
-1.0
fill
net change
scour
one flood
1.5
one year
-1.5
1.5
1.0
net change
0.5
0
-0.5
-1.0
-1.5
4-year period
0
1
2
3
4
5
6
Downstrean distance, miles
(b)
1.0
0.5
0.1
0.05
0.01
0.01
0.05
0.1
0.5
1.0
5.0
10
50
100
Unit discharge, cubic feet per second per foot width of channel
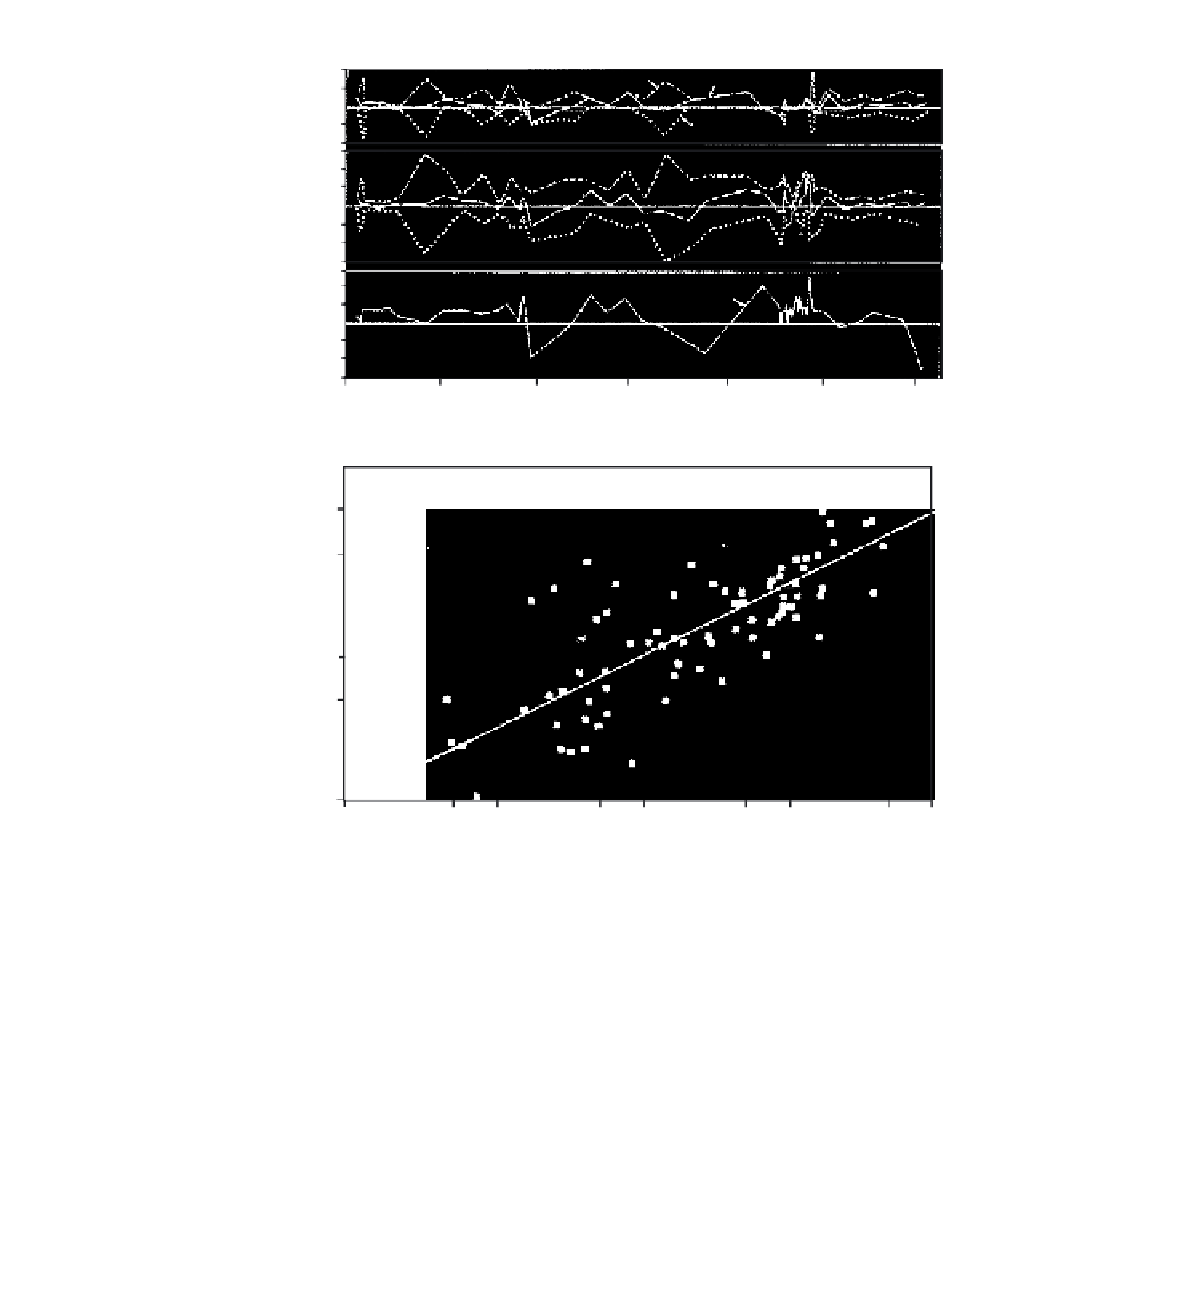
Figure 13.17
(a) Downstream pattern of bed scour and fill for different periods in the Arroyo de Los Frijoles, New Mexico. (b)
Average depth of scour as a function of flood peak discharge in the Arroyo de Los Frijoles (after Leopold, Emmett and Myrick,
1966).
Y 0.23m
u 2.9 - 4.4m.s
-1
Y 0.34m
u 3.8 - 5.7m.s
-1
A
′
A
′
A
A
28.5
28.5
m
m
28.0
28.0
27.5
pre-flow bed
post-flow bed
pre- & post-flow bed
max. scour
max. scour
0
25m
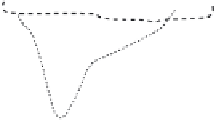
Figure 13.18
The patterns of scour and fill at one cross-section of Quatal Creek, California, during two flash floods of different
magnitude.
Y
is the calculated average flow depth;
u
is the calculated average flow velocity (after Foley, 1978).