Geoscience Reference
In-Depth Information
tributary
tributary
(a)
10
4
Perennial
Ephemeral
high
magnitude
event
tributary
10
3
tributary
low
magnitude
event
10
2
transmission
losses
10
1
recharge
recharge
10
0
Downstream
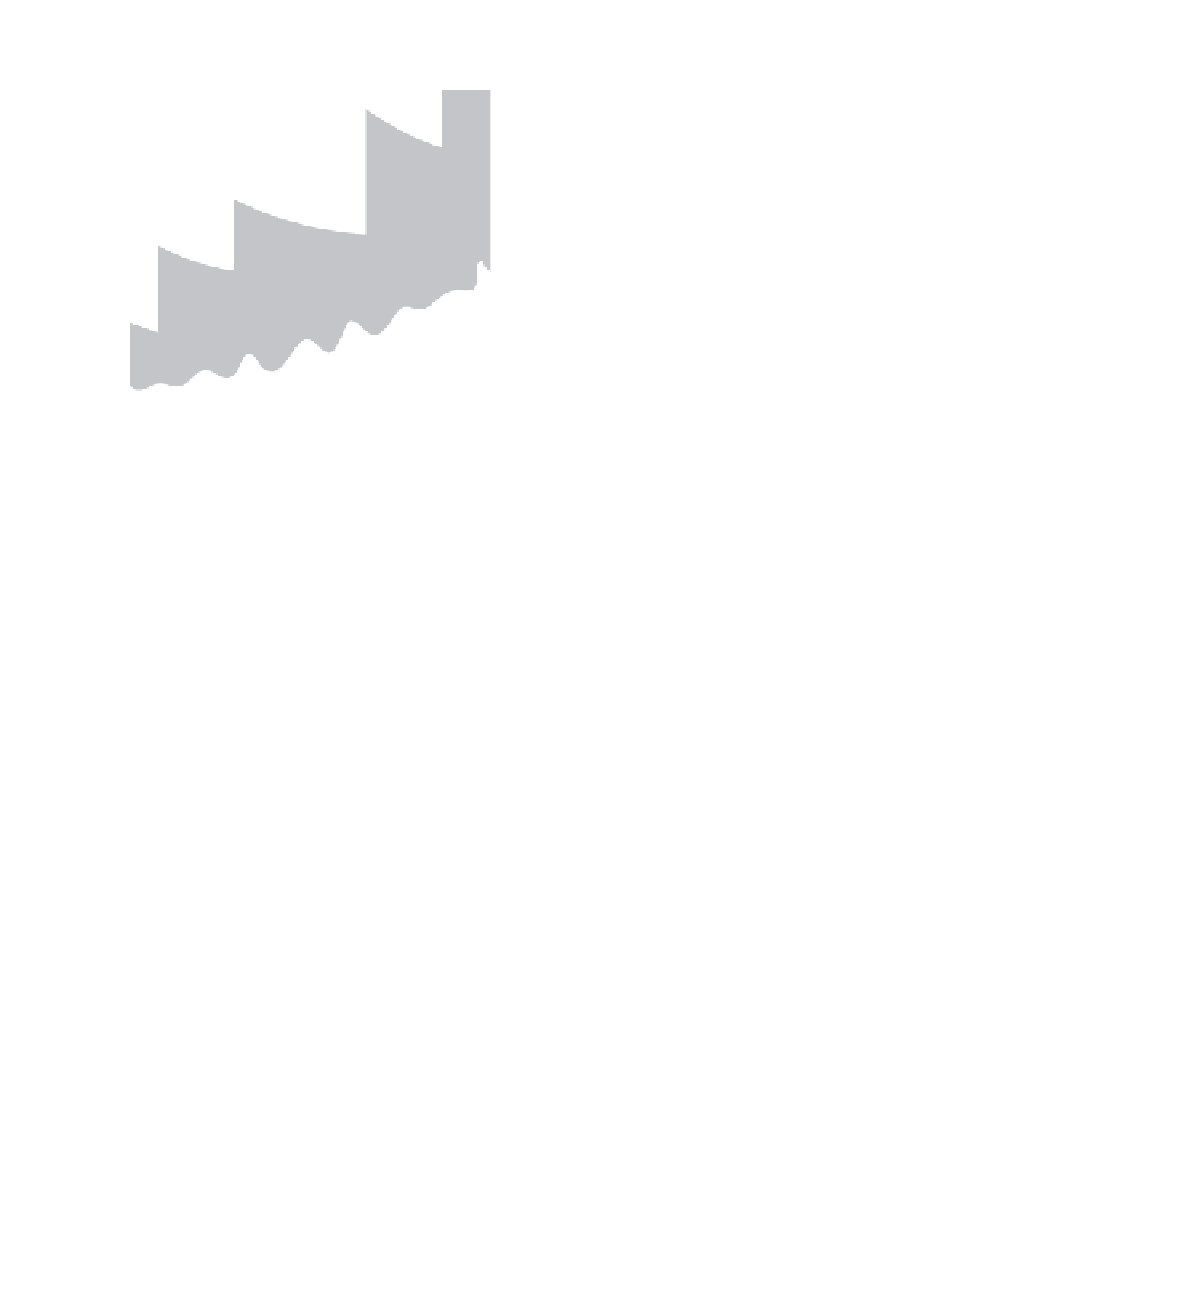
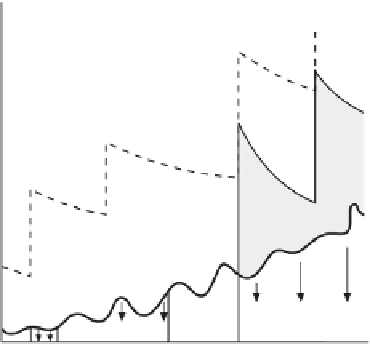
Figure 13.9
Conceptual model of the interplay of tributary
inflows and transmission losses during large and small flash
floods. The hachured areas represent net surface streamflow
(after Thornes, 1977).
10
-
1
10
0
10
1
10
2
10
3
10
4
10
5
(b)
10
3
Gerson (1978) demonstrated that the exponent in the log-
log relation between mean annual runoff and drainage
area of ephemeral streams in California is about half that
of the same relation for perennial streams of Maryland
(Figure 13.10). However, perhaps just as noteworthy in
the relation is the fact that there is far greater range in
runoff values among ephemeral streams for any particular
drainage area. It is tempting to speculate that this contrast
with the perennial stream case is a function of the spatially
discrete and highly variable rainfall pattern, together with
wide-ranging transmission losses and a host of other fac-
tors, including lithologically and pedologically controlled
runoff-rainfall ratios. Whatever the exact reasons, it high-
lights again the relative unpredictability of the ephemeral
drainage system.
Despite the expected differences in gross annual dis-
charge, Wolman and Gerson (1978) point to the un-
expected similarities in flood peak discharge between
ephemeral and perennial rivers having the same size
drainage basin (Figure 13.10). This must be fortuitous
from a process point of view given the now well-
established role of soil interflow, the diminutive role
of Hortonian overland flow and the general concept of
partial-area contribution to streamflow in humid environ-
ments (Hewlett and Hibbert, 1967) and the undoubted im-
portance of Hortonian overland flow in deserts (see Chap-
ter 11 and Bonell and Williams, 1986). Nevertheless, it is
interesting that desert streams can match perennial coun-
terparts at least in this one flood parameter, despite the
spottiness of the rainfall pattern, the transmission losses
10
2
10
1
10
0
10
-
2
10
-
1
10
0
10
1
10
2
Drainage area (km
2
)
Figure 13.10
(a) Annual runoff as a function of drainage
basin size for perennial rivers in Maryland and ephemeral
streams in California. (b) Peak flood discharge as a function of
drainage area for ephemeral and perennial streams (after Wol-
man and Gerson, 1978; data compiled from several sources).
Of potential value from an engineering standpoint is the
fact that the relations between mean annual flood peak dis-
charge and drainage area in different arid zones through-
out a number of continents have been shown by Farquhar-
son, Meigh and Sutcliffe (1992) to follow a reasonably
common trend. They also show a degree of similarity in
dimensionless flood frequency curves, although some re-
gions yield data that does not conform as well. This holds
the promise of being able to offer a best estimate of flood