Biology Reference
In-Depth Information
A
Drosophila melanogaster
Homo sapiens
Mus musculus
5
5
2
4
4
1.5
3
3
1
2
2
0.5
1
1
0
0
0
0
0.5
1.0
1.5
2.0
0
0.5
1.0
1.5
0
0.5
1.0
1.5
CpG ratio (obs/exp)
CpG ratio (obs/exp)
CpG ratio (obs/exp)
B
Distal
regulatory
elements
Gene
promoters
Gene
bodies
Repeats
CpGs
CpG island
High
Medium
Low
5mC
5hmC
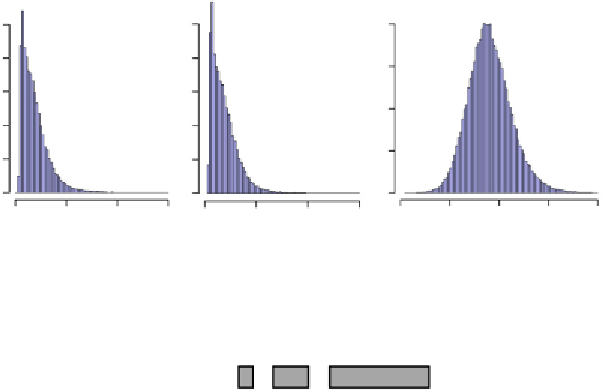
Figure 2.3 Distribution of CpG methylation and hydroxymethylation in mammalian
genomes. (A) Distribution of CpG density in animal genomes. The graphs show the
distribution of CpG ratios (observed over expected) measured in 1 kb windows in
human, mouse, and Drosophila genomes, which illustrates CpG depletion in mammals.
The CpG ratio was calculated using the following formula: (nCpGs
bp)/(nCs
nGs). (B)
Schematic distribution of CpGs, 5mC levels, and 5hmC levels in mouse ES cells. CpGs are
locally enriched at CpG islands that are found in many gene promoters. Most CpGs in
the genome are hypermethylated except those in CpG islands that are generally
unmethylated. CpGs in distal regulatory regions are moderately methylated and show
correspondingly elevated levels of 5hmC.
(80-90% of CpGs contain a 5mC), whereas CpG islands remain mostly
unmethylated (
Laurent et al., 2010; Lister et al., 2009; Stadler et al.,
2011; Xie et al., 2012
;
Fig. 2.3
B). Cytosine methylation is also abundant
in all classes of repeat elements. Advances in methylome profiling also iden-
tified low levels of methylation in non-CpG contexts, predominantly in ES
cells, oocytes, and brain (
Arand et al., 2012; Laurent et al., 2010; Lister et al.,
2009; Smith et al., 2012; Stadler et al., 2011; Tomizawa et al., 2011; Xie
et al., 2012; Ziller et al., 2011
). This suggests that two factors contribute
to nonsymmetrical methylation in mammals: either continuous high levels