Biology Reference
In-Depth Information
A
10,000
8000
6000
4000
H3K36me3
H3K27me3
H3K9me3
H3K4me3
2000
0
Pre-MBT
MBT
Post-MBT
B
C
Gain in:
Pre-MBT stage
H3K27me3
+3
H3K27me3
H3K9me3
MA2C
foxa2
Ihb
0
H3K4me3
−
1
5
H3K4me3
Peak
0
−
1.5
5
0
+3
H3K27me3
Pre-MBT
MA2C
0
−
1.5
5
0
RNAPll
−
1
H3K9me3
Peak
−
1.5
5
0
+3
H3K4me3
MA2C
0
−
1
−
1.5
5
0
−
1.5
5
0
H3K36me3
Peak
MBT
H3K27me3
Transcripts
±
TSS
H3K9me3
±
−
1.5
Tiled region
Transcript
49,269,790
10 kb
49,323,623
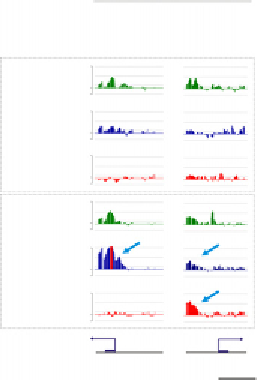
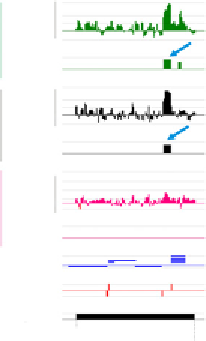
Figure 3.4 Marking of the zebrafish embryonic genome by posttranslationally modified
histones. (A) Developmental enrichment in H3K4me3, H3K9me3, H3K27me3, and
H3K36 me3 during pre-MBT, MBT, and post-MBT development. (B) Example of pre-
MBT promoter occupancy by H3K4me3 and RNAPII on an inactive locus (ChIP-chip
browser shot showing enrichment levels and peaks (arrow)); the tiled region covers
nucleotides 49,269,790-49,323,623 of chromosome 1. (C) Examples of gain of pre-
MBT H3K4me3-marked genes (upper track) in H3K27me3 (foxa2) and in H3K27me3
and H3K9me3 (lhb). (B and C) Modified from
Lindeman et al. (2011)
.