Game Development Reference
In-Depth Information
If you were to run this code in your debugger you would be able to set a breakpoint on the line
containing the closing brace for the function block. Your debugger should have two variables shown
in the local variables window. Figure
9-1
shows the local variable window from a Visual Studio
integrated development environment (IDE).
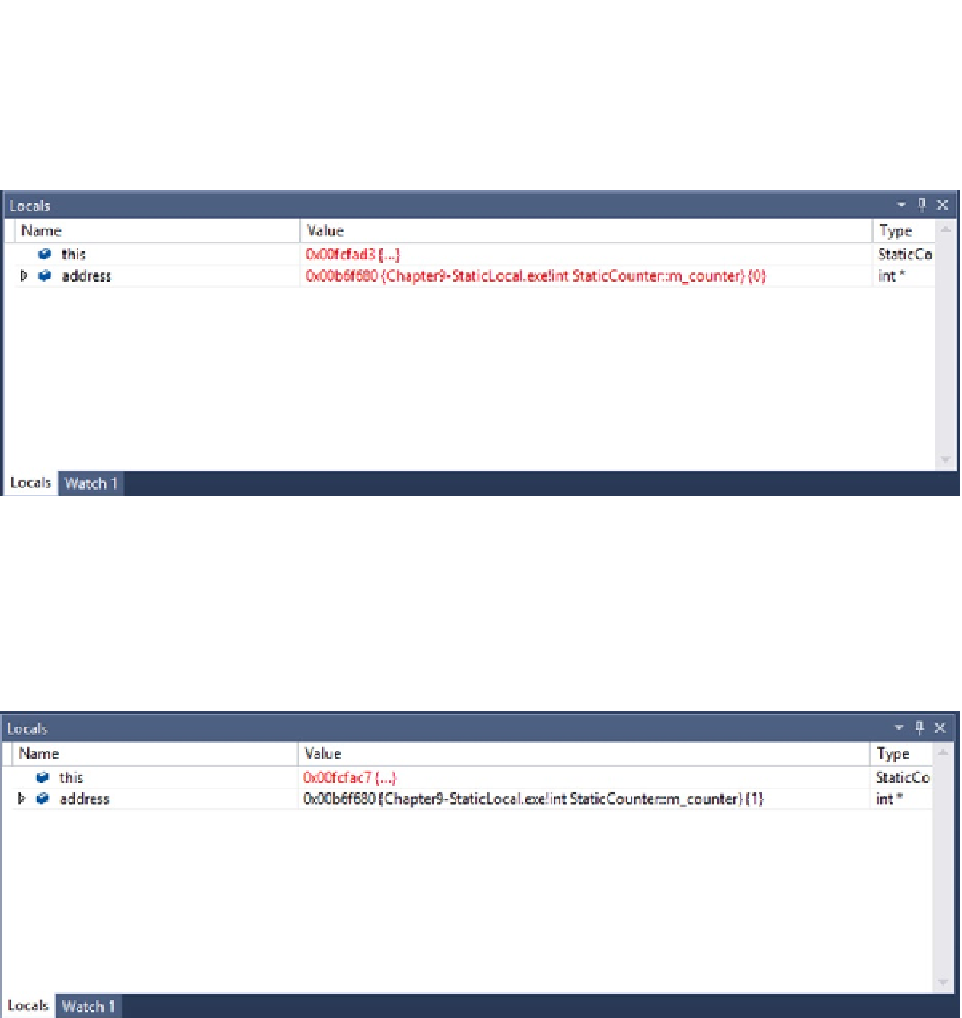
Figure 9-1.
The
counter1 this
address
Figure
9-1
shows the state of the debugger when execution stops in the
Print
method that has been
called on the
counter1
object. You can see that the address of
counter1
is stored in the
this
pointer
and is
0x00fcfad3
. The
address
variable that stores the address of
m_counter
holds the address
0x00b6f680
. Figure
9-2
shows the same variables when
Print
is called on the
counter2
object.
Figure 9-2.
The
counter2 this
address
You can see in Figure
9-2
that the value stored in
this
has changed. The Visual Studio debugger has
helpfully displayed the value in red to show that the value has changed. Both values in Figure
9-1
are red as they were both new values that were being shown. The address of
counter2
is now stored
in the
this
pointer and is
0x00fcfac7
. Despite the change in the object address, the address of
m_
counter
has stayed exactly the same and is a direct result of using the
static
keyword on the member
variable of the
StaticCounter
class. Every instance of the
StaticCounter
class would now use the
exact same
m_counter
variable and any change to this variable will be shared.