Environmental Engineering Reference
In-Depth Information
Table 11.6 Coast down test measured times
Results
High speed: 60-57.5 mph
Low speed: 10-7.5 mph
Time
t
1
= 3.613 s
t
2
= 10.56 s
Average velocity (m/s)
V
1
= 26.26
V
2
= 3.912
Average acceleration (m/s
2
)
a
1
= 0.3086
a
2
= 0.106
Coast down test results are summarized in Table 11.6 in the case of the tractor-
only testing. The trial times shown are the result of four back-and-forth runs.
Equations (11.9) and (11.10) predict a drag coefficient
C
d
¼
0.659 and
rolling resistance
R
0
¼
0.010 for the semi-tractor. In a coast down test from 60 mph
(26.82 m/s) to zero, the measurement time slices were taken from 60 to 57.5 mph
and again from 10 to 7.5 mph to obtain as closely spaced intervals as possible. The
time intervals were then used to estimate the average deceleration at the average
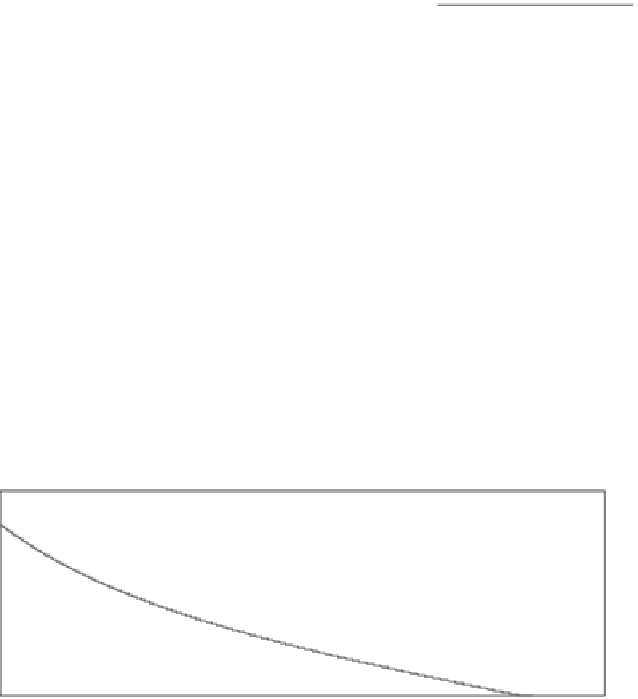
speed within an interval as depicted in Figure 11.1. As a check on these calculations
the tractor specification data from Table 11.5 were put into a simulation pro-
gramme to calculate the deceleration velocity versus time. The results of that
analysis are shown in Figure 11.7.
Vehicle acceleration
80
80
60
1
0.447
V
n
, 1
40
20
0
0
0
50
100
150
200
0
220
V
n
, 0
Time (s)
Figure 11.7 Class-8 tractor coast down simulation
In the simulation performed for the case of the class-8 tractor only, the cal-
culated values of drag and rolling resistance agree very well with simulated values.
For the curve shown in Figure 11.7, the total coast down time from 60 mph to
standstill is 180.5 s. The acceleration slopes at 58.25 and 8.25 mph agree very
well with measured values when the drag coefficient is modified only slightly to
C
d
¼
0.654 and rolling resistance is left unchanged at
R
0
¼
0.010.
Table 11.7 summarizes the pertinent data on the semi-tractor that will be used
to evaluate the impact of towing a trailer.