Environmental Engineering Reference
In-Depth Information
a
1
V
a
1
<
V
1
>
V
a
2
V
b
1
<
V
2
>
V
b
2
a
2
Time (s)
t
1
t
2
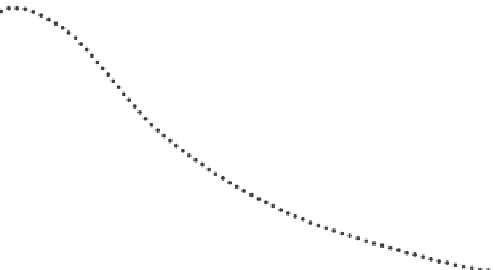
Figure 11.1 Vehicle coast down test
The speeds are in kph but converted to m/s for analysis of the coefficients. The
deceleration values over these same intervals are easily calculated as
V
a
1
V
a
2
t
1
a
1
¼
(m
=
s
2
)
ð
11
:
6
Þ
V
b
1
V
b
2
t
2
a
2
¼
The procedure described in Figure 11.1 is valid because the two components of
road load during the coast down test are tyre rolling resistance and aerodynamic
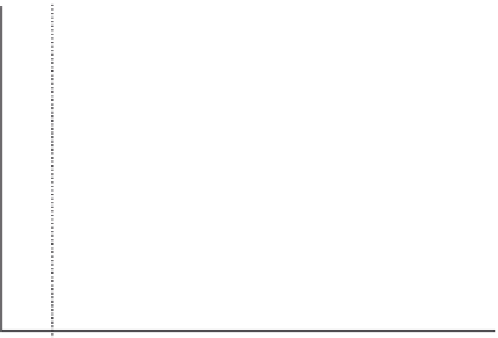
drag. These two components are put into perspective with the aide of Figure 11.2.
100
90
80
70
60
50
40
30
20
10
0
Rolling
resistance
Aerodynamic
drag
0
10
20
30
40
50
60
70
80
Vehicle speed (mph)
Figure 11.2 Road load components in coast down testing