Environmental Engineering Reference
In-Depth Information
1
1
0.8
0.6
m
(
i
)
0.4
0.2
0
0
0
20
40
60
80
100
0
s
(
i
)
100
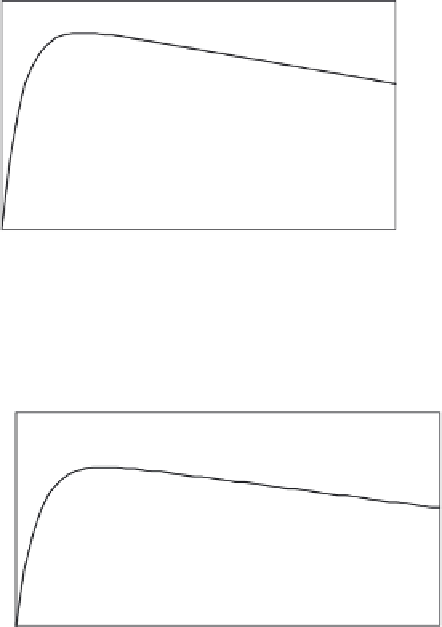
Wheel slip (%)
Figure 1.26 Wheel slip curve when
m
pk
= 0.85
8,000
8,000
6,000
F
trac_lim
(
i
)
4,000
2,000
0
0
0
20
40
60
80
100
0
s
(
i
)
100
Wheel slip (%)
Figure 1.27 Tractive force limits from (1.19)
The achievable acceleration is sufficient to meet performance goals of ~0.3-
0.45
g
acceleration. The point to note is that wheel slip is substantial, meaning that
engine speed will be higher than a simple calculation based on gear ratios would
lead one to believe. This fact can be seen by rewriting (1.18) as (1.23) for the wheel
slip in terms of vehicle velocity,
V
, and wheel angular velocity,
w
w
:
100
V
w
w
r
w
s
¼
1
ð
%
Þ
ð
1
:
23
Þ
An assessment of the vehicle performance, principally the 0-60 mph accel-
eration time, is accomplished by solving the equations of motion for engine tractive
effort, tyre slip, rolling and aerodynamic loads, and integrating until the final speed
is reached.