Environmental Engineering Reference
In-Depth Information
Table 9.3 Drive cycle statistics
Region
Cycle
Time
idling (%)
Maximum
speed (kph)
Average
speed (kph)
Maximum
acceleration
(m/g
2
)
Asia-Pacific
10-15
32.4
70.0
22.7
0.79
Europe
NEDC
27.3
120.0
32.2
1.04
NA-city
EPA-city
19.2
91.3
34.0
1.60
NA-hwy
EPA-hwy
0.7
96.2
77.6
1.43
NA-US06
EPA
7.5
129.0
77.2
3.24
Industry
Real world
20.6
128.6
51.0
2.80
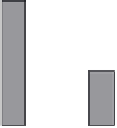
The vehicle energy consumption of 0.5 kWh/mi listed for the gaseous hydro-
gen FCV is broken down in Reference 7 to reflect losses due to the fuel cell plant,
M/G and transmission plus auxiliary electrical loads over the Federal Urban Drive
Schedule (FUDS) cycle. Figure 9.5 compares the breakdown of the total vehicle
energy consumed on the FUDS cycle by the FCV and the FCHV.
0.6
H
2
FCHV
H
2
FCV
0.5
0.4
0.3
0.2
0.1
0
Figure 9.5 Energy breakdown by major driveline component for FCV and FCHV
Not surprisingly, the fuel cell system losses comprise the majority of energy
loss in the fuel cell power plant vehicles regardless of whether they are hybridized
or not. This includes power to drive the air compressor, coolant pumps, radiator
fans and other loads, and it equates to some 45% of the energy consumption on the
FUDS cycle. Vehicle auxiliary loads represent the balance of the vehicle electrical
consumption such as cabin climate control, body electrical systems such as lighting
and seat controls, and all chassis systems including braking and steering. Today, the
nominal vehicle electrical burden is 700 W for test purposes on regulated cycles.
Vehicle peak electrical loads are approximately 1.5 kW for compact cars, 2.8 kW
for mid-size and 3.5 kW for luxury vehicles. Most of the increase is due to year-
over-year incremental feature additions. As more, higher powered functions are
electrified,
loads are expected to range upwards of 10 kW peak. This is not