Environmental Engineering Reference
In-Depth Information
ATDS vehicle speed and acceleration (0.5 s increments)
30.0
80
25.0
70
20.0
60
15.0
10.0
50
5.0
40
0.0
30
5.0
10.0
15.0
20
10
20.0
25.0
0
0
200
400
600
800
1,000
1,200
1,400
1,600
1,800
Time (s)
Figure 1.23 Real world customer drive cycle
There have been many surveys of consumer driving habits. An extensive sur-
vey of customer usage patterns was performed by Sierra Research and covered
various geographical and urban environments in North America. The results of that
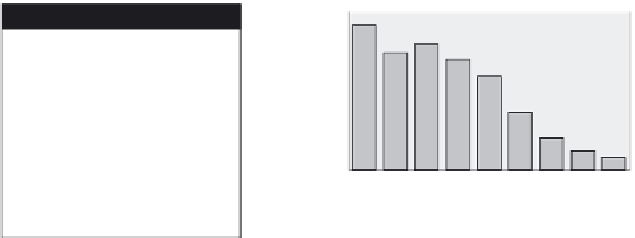
survey can be summarized in a tabulation of stop events and duration and a histo-
gram plot. These are shown in Figure 1.24(a) and (b), respectively.
70,000
14
Cycles per 91k miles
Discharge per event
12
60,000
10 s
1,06,371
147.7 h
20 s
32,019
133.4 h
10
50,000
30 s
35,580
247.1 h
40,000
8
45 s
19,418
202.3 h
6
30,000
60 s
8,382
122.2 h
4
120 s
8,436
210.9 h
20,000
240 s
2,571
128.6 h
2
10,000
480 s
1,127
112.7 h
0,000
0
720 s
293
48.9 h
Total
2,14,198
1,353.9 h
Average event
time
22.8 s
(a)
(b)
Figure 1.24 Tabulation of driving habits: (a) event duration/number/cumulative
time; (b) histogram of tabulated data (dark grey)
Figure 1.24 also contains the distribution of battery discharge capacity (Ah)
assuming idle-stop strategy for which the battery supports the vehicle electrical
loads during engine-OFF intervals.
1.4.4 Hybrid vehicle performance targets
This section concludes with a summary of performance targets that are consistent
with PNGV goals and a compilation of representative parameters for a mid-size
passenger vehicle and a pick-up truck or SUV (Table 1.9). These data will then be