Environmental Engineering Reference
In-Depth Information
1.984824
2
0
1.994946
2
0
100
200
300
400
0
359
i
e
U
(
i
)
e
C
(
i
)
(
a
)
1.5
1
U
1
(
i
)
0
1.5
0
100
200
300
400
0
359
i
(
b
)
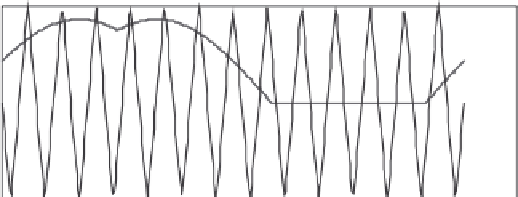
Figure 6.16 Synchronous sampling of SVPWM modulating function:
(a) synchronous sampling and (b) inverter phase a mid-point
voltage to negative bus
and moreover, if the carrier triangle waveform is set to an integer of nine samples
per fundamental, the PWM patterns for inverter output phases
U
1
,
U
2
and
U
3
can be
obtained.
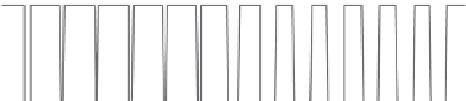
The PWM waveform in Figure 6.16 is very similar to that obtained for sinu-
soidal synchronous PWM. However, the line-to-line voltages for SVPWM are now
very different as can be seen in the waveforms of Figure 6.17. In this instance, the
inverter pole (
U
1
is the phase
a
pole composed of switches S1 and S2, and so on for
the others) to negative bus voltages are subtracted, which eliminates the interim
negative bus reference leaving only the corresponding voltages.
It is apparent from Figure 6.17 that the PWM pattern is symmetrical in the pulse
placement as expected and, furthermore, there is no redundant switching in a phase
leg. Also, some of the line-to-line pulses have two levels. The SVPWM is the most
efficient in terms of low switching losses in the inverter and maximum utilization of
the dc link voltage. In fact, the maximum modulation index for SVPWM is
2
m
i
SVPWM
¼
p ¼
1
:
15
ð
6
:
24
Þ