Environmental Engineering Reference
In-Depth Information
60
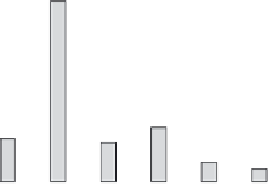
Present 14 V
Future 42 V/14 V
50
40
30
20
10
0
22
20
18
16
14
12
10
8
6
4
Wire gauge
Figure 4.44 Distribution of wire gauge size
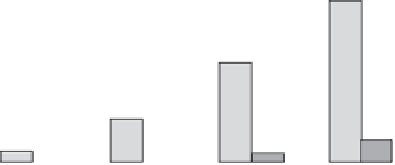
Electronic
Silicon
2,000
1,500
1,000
500
0
1977
1989
1994
2000
Year
Figure 4.45 Value of electronic content and silicon content of average car
Wire harness current carrying capacity is illustrated in Figure 4.46, where it
can be seen that current capacity decreases somewhat linearly for decreasing wire
gauge.
40
35
PVC
XLPE
30
25
20
15
10
5
0
22
20
18
16
14
12
10
8
Wire gauge
Figure 4.46 Wire current carrying capacity versus wire gauge. Allowable current
densities (A/mm
2
):
d
T
=50
C for PVC,
d
T
=95
C for XLPE