Biomedical Engineering Reference
In-Depth Information
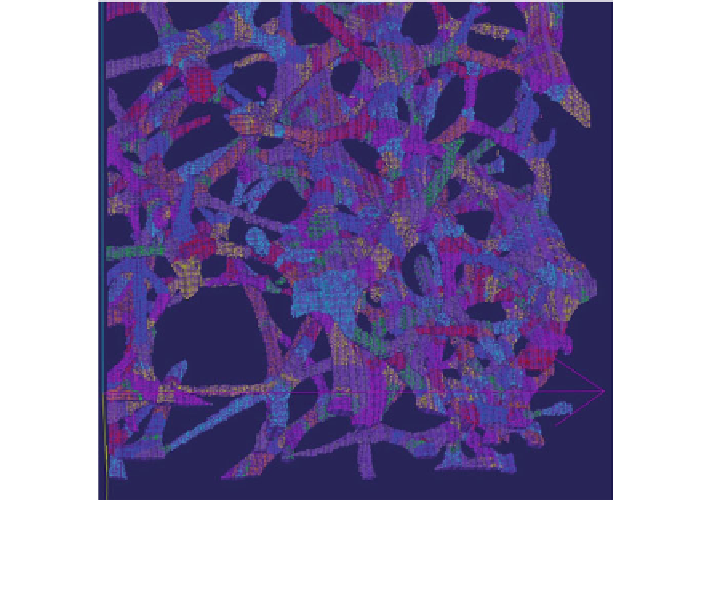
Fig. 6 Colour-coded 3D-rendered image of trabecular bone from the intertrochanteric region of
the femur showing decomposition of the trabecular structure into individual trabeculae elements.
(colour coding of individual trabeculae provides visual contrast between trabeculae and is not
indicative of morphology)
The availability of 3D voxel-based datasets of trabecular bone has driven the
development of quantitative tools to validate insights gained from histological
studies and to extend morphometric capabilities to more realistic representations
of the 3D structure of trabecular bone. Through implementation of an algorithm
that fit spheres to 3D datasets, ''real'' measures of trabecular diameter and tra-
becular separation are possible [
47
,
48
]. Together with algorithms that describe
how plate-like or rod-like the structure is (Structure model index, SMI) [
47
,
48
],
whether there is preferential orientation of the structure (Degree of anisotropy,
DA) [
112
] or how well connected the structure is (Connectivity Density. Conn.
D) [
80
]. Suites of histomorphometric measures are available within commercially
available micro-CT systems. More recently, in parallel, Stauber et al. [
100
,
101
]
and Liu et al. [
63
] have developed algorithms that volumetrically ''decompose''
the trabecular structure into individual elements, which are then classified as rods
or plates (Fig.
6
). These tools provide the size, shape and orientation of the
individual trabeculae, which enables study into how individual trabecular mor-
phology or orientation contributes to the mechanical properties of the structure as
a whole [
65
,
102
].
Search WWH ::

Custom Search