Biomedical Engineering Reference
In-Depth Information
15
Scan 1
Scan 2
14
Scan 4
13
Scan 3
12
11
10
9
8
7
6
0
15
30
45
60
75
Distance from Haversian canal
µ
m
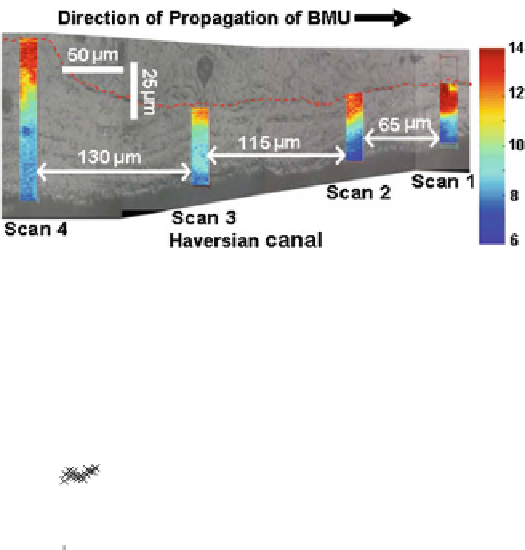
Fig. 2 Mineralization of osteoid within a basic multicellular unit (BMU). Raman microspec-
troscopic maps of mineral matrix ratio are overlayed with the optical image. The cement line is
highlighted by a dashed line. Bone formation, temporally, occurs from left to right and from top
to bottom. New bone is formed at the lower section of the mapped regions (haversian canal
surface) where osteoblasts are active. Mineralization increases sigmoidally with with distance
from the Haversian canal
crystals. This process extends over a few days to reach 60-75% of the minerali-
zation of the osteoid [
26
,
116
]. Secondary mineralization is a much slower process
that proceeds for several months, during which the mineral gradually matures
through the process of crystal growth [
79
]. Recent studies reported that secondary
mineralization may last longer than previously thought. Raman microspectro-
scopic analysis of primary lamellar bone fragments which survived resorption
indicated that crystal growth can last for several decades [
5
]. It appears that the
supersaturation of interstitial fluid counters the entropic cost of crystal growth
and the overall thermodynamics favor crystal growth in the very long term.
The repercussions of such long term crystal growth on bone matrix, such as
buildup of residual stresses, are currently unknown.
Mineralization at a specific site reflects the age of the mineral crystals involved;
newly formed regions (secondary osteons) are less mineralized whereas old
regions (primary osteons or lamellae) are highly mineralized [
124
,
126
]. The net


Search WWH ::

Custom Search