Agriculture Reference
In-Depth Information
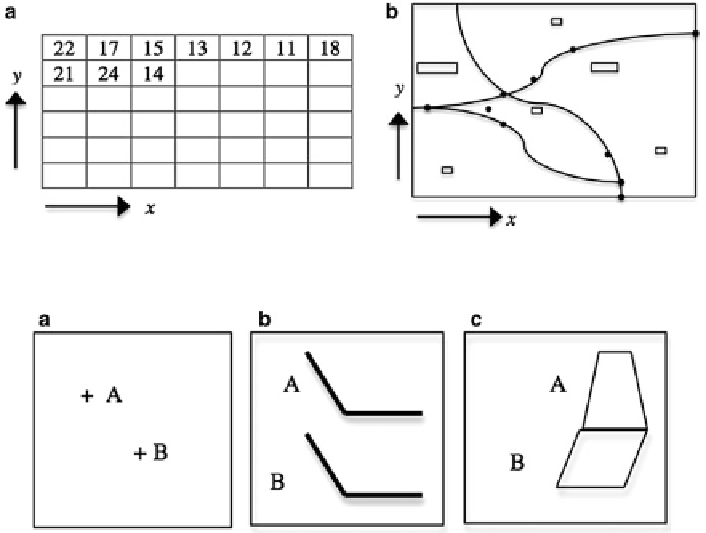
Fig. 3.2 Examples of raster (a), and vector data (b)
Fig. 3.3 Example of spatial objects: (a) points, (b) lines, (c) areas
An area (or polygon) is defined as a two-dimensional continuous object (see
Fig.
3.3c
). Polygons are used, for example, to represent the boundary of a city (on a
large scale map), lake, or forest. Furthermore, they can be used to measure the
surface and perimeter of a geographical feature.
Economic flow data constitute the main basis of studies on spatial interactions
between individual economic agents and regions. Some examples of this type of
spatial data are commuting flows between regions, the flows of people and goods
along communication and transportation networks, travel for the purchase or use of
services (i.e., shopping-trips), and hydrological fluxes that are very important in
agriculture.
Spatial data can be described by a GIS using two different approaches (Neteler
and Mitasova
2008
):
1. Field representation, where each point or area-element (pixel, see Chap.
4
for
details) in the space has an assigned value. This leads to the raster data model.
2. Geometrical objects representation, where geographic characteristics are
described in terms of lines, points, areas, and are given by their coordinates.
This leads to the vector data model.
Search WWH ::

Custom Search