Agriculture Reference
In-Depth Information
K
-function to account for edge effects. The most commonly used was proposed by
Ripley (
1977
). However, in Besag
s paper, he showed
that this correction gave excessive weight to the most distant neighbors.
The
R
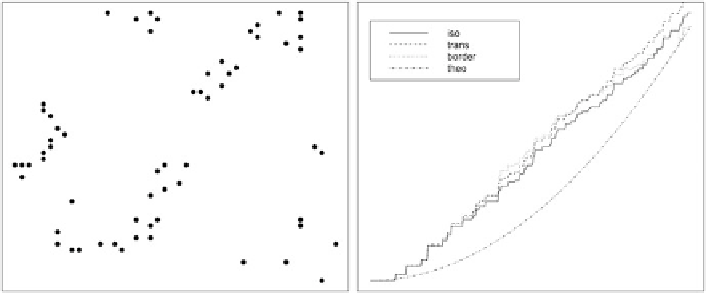
package for spatial point pattern analysis is spatstat. Here, we have
used the redwood data set, which represents the locations of 62 California red-
wood tree seedlings and saplings in a square sampling region. They are available in
the spatstat package. The routine to estimate Ripley
s(
1977
) discussion of Ripley
'
'
s
K
-function is Kest.
'
>
library(spatstat)
>
data(redwood)
>
K
<
- Kest(redwood)
>
par(mfrow
¼
c(1,2),mar
¼
c(1,1,1,1))
>
plot(redwood$x,redwood$y,cex
¼
1,pch
¼
19,axes
¼
F)
>
box()
>
plot(K$r,K$iso,type
¼
"l",lty
¼
1,axes
¼
F)
>
box()
>
lines(K$r,K$trans,lty¼2)
>
lines(K$r,K$border,lty¼3)
>
lines(K$r,K$theo,lty¼4)
>
legend(0,0.2,c("iso","trans","border","theo"),lty¼c(1,2,3,4))
The second graph of Fig.
1.4
shows the estimates of the
K
-function obtained with
different methods for edge correction (border, isotropic, and translate) and the
theoretical value (theo) for a stationary Poisson process (Ripley
1988
).
Interested readers can find further details of the spatstat package in the
reference manual at
http://cran.r-project.org/web/packages/spatstat/spatstat.pdf
.
Fig. 1.4 Point pattern (
left
) and
K
-function estimates (
right
)
Search WWH ::

Custom Search