Agriculture Reference
In-Depth Information
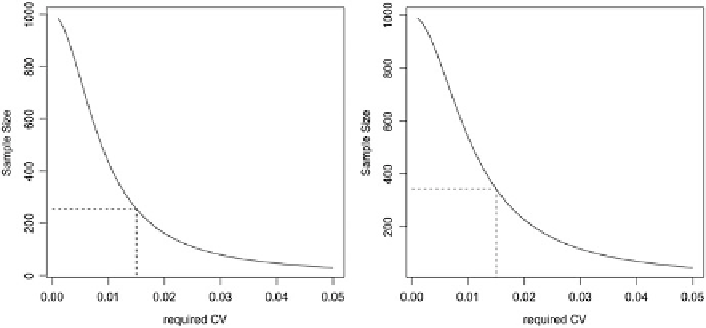
Fig. 8.1 Sample size estimation for a synthetic population of size
N
¼
1,000 for two variables:
yobs (
left
) and yobs3 (
right
)
>
sampsize
[1] 254.1346
>
max(ceiling(sampsize),5)
[1] 255
A population of units (
N
¼1,000) with geographical coordinates (xc,yc) was
generated from a uniform [0,1] distribution. The variables yobs2 and yobs3 were
generated according to different spatial trends and variances, while the variable
q1obs is a random qualitative variable used for the stratification or domain code.
We obtained the result shown in Fig.
8.1
by repeating the sample size evaluation
for every
c
in the range [0.001, 0.05] (in steps of 0.001), for the two variables yobs
and yobs3. The variable with lower variance (yobs on the left) required fewer
sample units than the variable with higher variance (yobs3 on the right). This is
because the sample size also depends on the totals of each variable.
Suppose that we want to estimate the totals for several variables of interest and,
thus, to estimate the sample size that satisfies a given upper bound for each
coefficient of variation. In SRS the only possible solution is to apply the rule in
Eq. (
8.9
) to each variable, and then use the maximum sample size. This is no longer
true when dealing with stratified sampling, as we will highlight in the next section.
8.3 Sample Size Estimation for Stratified Sampling
A stratified sample may be allocated over several strata in various ways. If we
require separate survey estimates for each stratum, the strata sample sizes can be
decided separately following an SRS selection. However, we often require the
Search WWH ::

Custom Search