Agriculture Reference
In-Depth Information
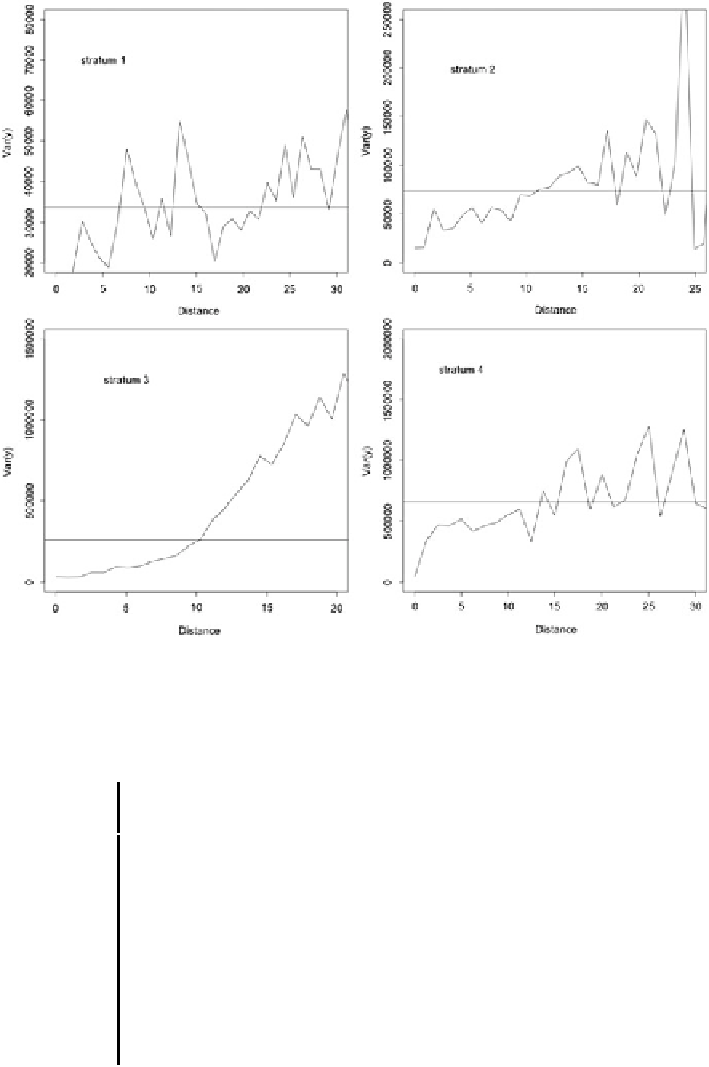
Fig. 7.10 Semivariograms of the ANC variable within each of the four strata
Table 7.5 Relative efficiency of the sample mean (MSE/MSE
SRS
) for each design, estimated
using 10,000 replicated samples from the EMAP lakes population, for different sample sizes, with
and without spatial stratification
Not spatially stratified
Spatially stratified
Design
n
¼
10
n
¼
50
n
¼
100
n
¼
10
n
¼
50
n
¼
100
SRS
1.00
1.00
1.00
0.52
0.77
0.82
GRTS
0.90
0.83
0.79
0.47
0.75
0.80
CUBE 1
0.95
0.99
0.93
0.47
0.74
0.76
CUBE 2
0.95
0.97
0.91
0.45
0.61
0.62
DUST 1
1.16
1.63
1.72
0.37
0.57
0.63
DUST 2
1.08
1.45
1.39
0.39
0.53
0.66
SCPS
0.80
0.66
0.56
0.44
0.56
0.53
LPM 1
0.75
0.62
0.46
0.42
0.47
0.45
LPM 2
0.81
0.67
0.54
0.48
0.58
0.54


Search WWH ::

Custom Search