Agriculture Reference
In-Depth Information
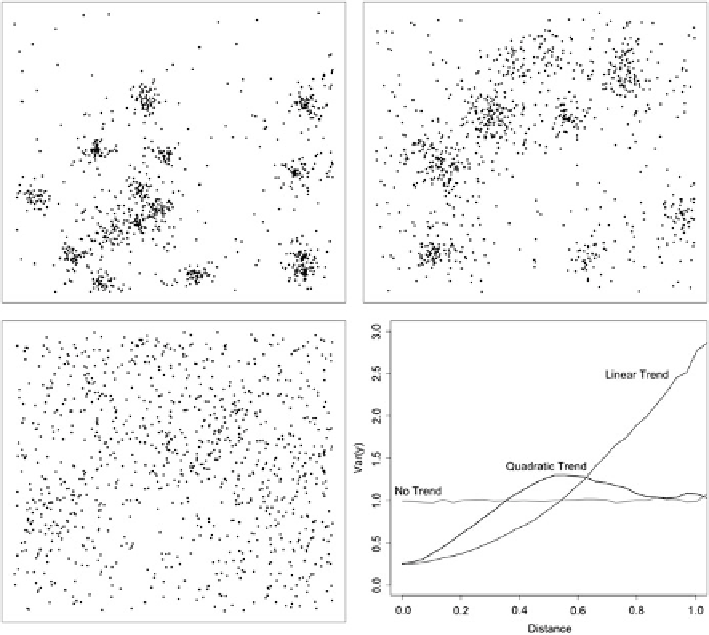
Fig. 7.8 Spatial distribution of three populations: highly clustered (
top-left
), clustered (
top-right
)
and sparse (
bottom-left
). The semivariograms (
bottom-right
) are relative to the target variable
y with very weak spatial dependence (
ˁ
¼0.001)
MSEs were always very close to the variance of each design because the HT
estimator was unbiased. Thus, the reported value can be considered as a design
effect (DEFF, see Chap.
6
).
We analyzed the performances of GRTS, balanced sampling constrained to first
and second-order moments of the coordinates (i.e., CUBE 1 and 2), the DUST
technique with tuning parameters equal to 1 and 2 (i.e., DUST 1 and 2), SCPS, and
LPM 1 and LPM 2.
The results reported in Tables
7.1
,
7.2
, and
7.3
show that GRTS is inadequate for
planning a survey of these populations when there is no trend and low homogeneity
of the data. In these cases, it is similar to SRS, showing that its spread over space is
too light to substantially reduce the sampling errors.
The CUBE algorithm preserved the robustness properties, even when dealing
with spatial data. It had an MSE very close to SRS when there was no trend in the
data. Conversely, it considerably increased the efficiency as the correlation of the
variable y with the coordinates increased. There was a marked increase in efficiency
Search WWH ::

Custom Search