Biology Reference
In-Depth Information
of the actin structures but allow for qualitative evaluation of GFP-actin
distribution throughout the cell body, which is composed of both the
polymeric (f-actin) and monomeric (g-actin) components. Consistent with
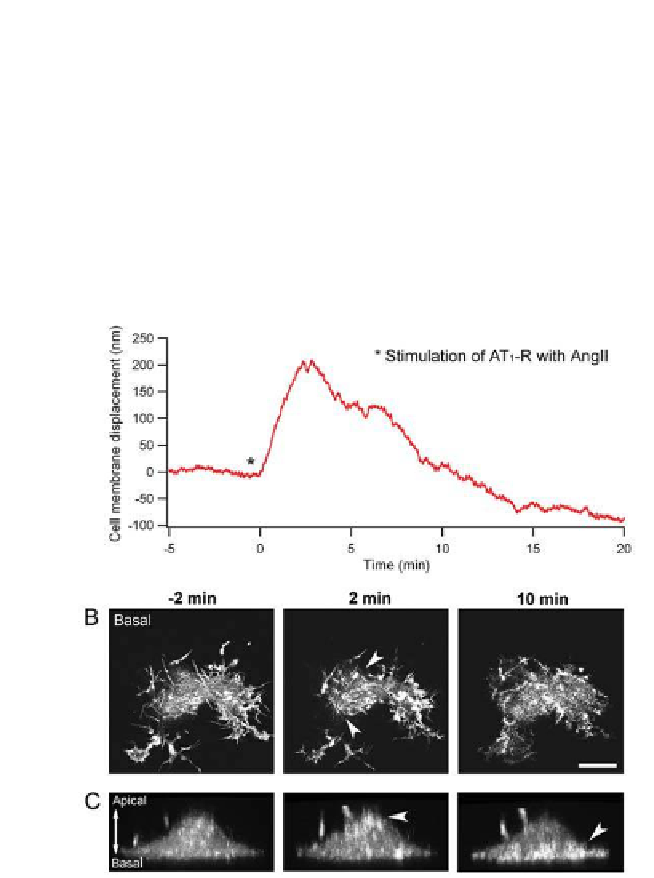
the contraction observed in the phase contrast image (
Fig. 17.2b,c
)
, a
notable reorganization of the actin structure towards the centre of the cell
actin content at the apical region of the cell (
Fig. 17.4c
, see arrowhead at
2 minutes), which is consistent with the height increase observed by AFM.
(a)
(b)
(c)
Figure 17.4.
Confocal imaging of HEK-293 cells, co-transfected with AT
1
-R and GFP-
actin, in relation to the mechanical response measured with the AFM. (a) Mechanical
response observed after stimulation with 100 nM AngII (same condition as
Fig. 17.2a
)
.
(b) Confocal micrographs of 1
m thick section recorded in the basal region of the cell
showing actin structures. Micrographs are presented at selected time before and after
AngII stimulation (−2, 2 and 10 minutes). The luorescent background is attributed
to the monomeric component of GFP-actin. The arrows indicate the apparent
contraction of the cell body. (c) Transversal views of an individual cell, constructed
from 55 sections of 250 nm, before and after AngII stimulation. The arrows show
the redistribution of the GFP-actin to apical and basal regions of the cell at 2 and
10 minutes after AngII stimulation. Scale bar corresponds to 10 μm. Reprinted with
permission from Ref. 23.
M


Search WWH ::

Custom Search