Biology Reference
In-Depth Information
(b)
(a)
(c)
(d)
(e)
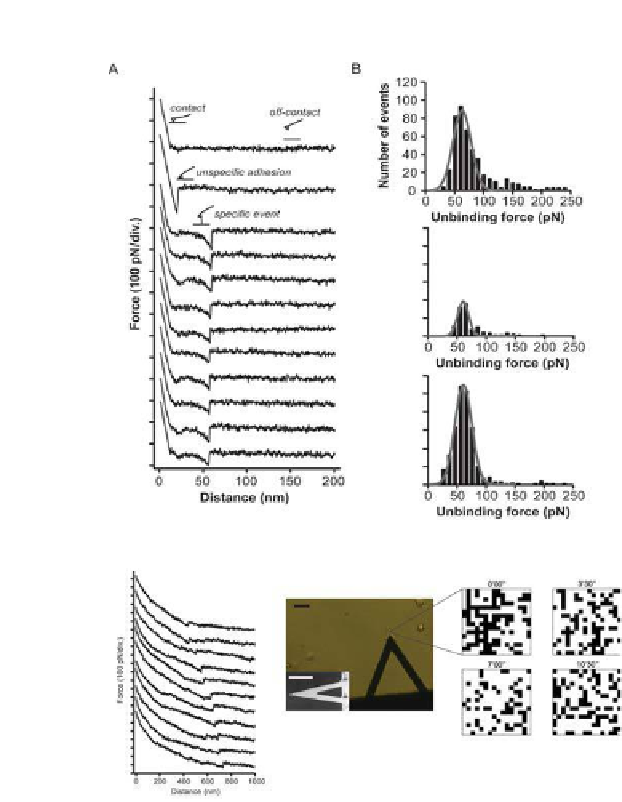
Figure 12.3.
Mechanics of transferrin and transferrin receptor interactions. (a) Force
curves obtained on a mica surface using an AFM probe coated with holo-transferrin.
(b) Histograms of (top) unbinding force, (middle) in the presence of excess amount
of holo-transferrin, (bottom) recovery of adhesion events after washing out excess
transferrin. On a live cell membrane, (c) force curves, (d) mapping procedure, (e)
results of mapping transferrin receptors on an area of 2 μm × 2 μm with a time lapse
of 3.5 minutes. Dark squares represent areas where strong interaction was observed.
Reproduced with permission from Yersin
et al.
31
The loading rate dependency of the mean of the force histograms was also
reported for both types of transferrin. What was most striking was that the
loading rate dependency plot of holo-transferrin had a break in the middle
of the plot whereas the one for apo-transferrin was a straight line within
the range of experimentally explored loading rate. From the slope and the


Search WWH ::

Custom Search