Biology Reference
In-Depth Information
force is reached. After a deined contact time, the cell is withdrawn at
constant velocity. Bonds between cell and substrate sequentially break until
cell and substrate are completely separated (
Fig. 10.3
). During the approach
and retract process, the force acting on the cantilever, which is proportional
to the cantilever delection, is recorded in a force-distance (F-D) curve.
Parameters inluencing the experimental results, such as contact force and
time, contact condition (constant height, constant force) and pulling velocity
can be precisely controlled.
10.3.3 Interpretaon of F-D Curves
When interpreting F-D curves, it must be considered that they contain
information about the established interactions between cell and substrate
and about mechanical properties of the cell.
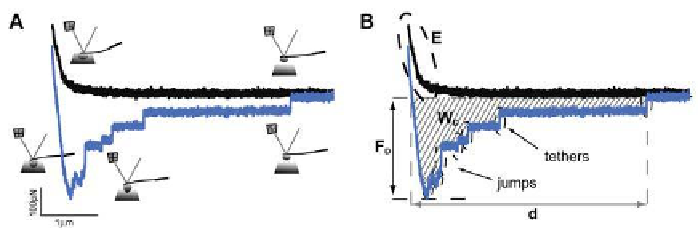
show characteristic complex interaction patterns. Approach F-D curves (
Fig.
the cell is in contact with the substrate. The slope of the F-D curve in this
contact region (dashed ellipse E) can be used to extract elastic properties of
the cell. The retraction F-D curve (
Fig. 10.4
, blue) is typically characterized
by the maximum force required to separate the cell from the substrate
referred to as the detachment force (
28,35,47
F
D
).
F
D
is followed by
step-like events,
which are either
preceded (jumps) or not preceded (tethers) by a ramp-like
increase in force.
(a)
(b)
Figure 10.4.
Information extracted from an F-D curve. (a) Schematic representation
of the F-D cycle and recorded F-D curves. The approach curve is shown in black,
retraction curve in blue. (b) Information that can be obtained from the F-D curves:
F
D
maximal force required to detach the cell from the substrate,
E
elastic properties,
W
D
adhesion work,
d
distance required for complete separation of cell from the substrate,
discrete force steps (jumps and tethers).


Search WWH ::

Custom Search