Biology Reference
In-Depth Information
(a)
(b)
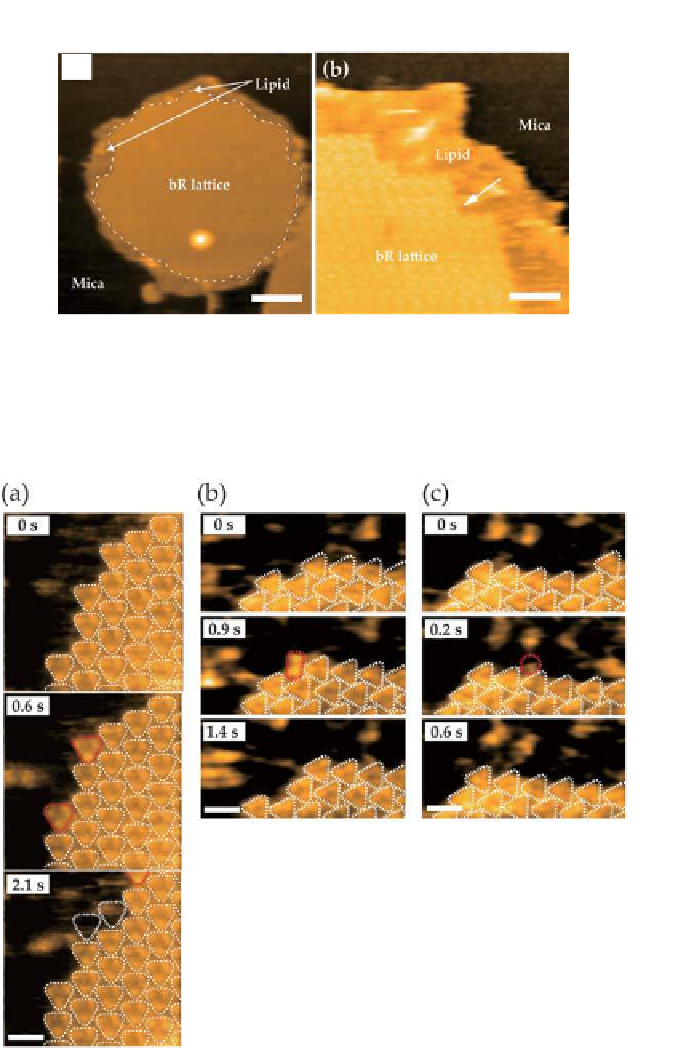
Figure 8.4.
AFM images of purple membranes adsorbed onto a mica surface. (a) Low
magniication image indicating that the purple membrane patch consists of a crystal
area (encircled with a dotted line) and a non-crystal area (the periphery of the crystal
area). (b) A magniied image of the edge region of the membrane patch captured at
1 frame/s. Scale bars: (a) 80 nm (b) 20 nm.
(c)
(a)
(b)
Figure 8.5.
Time-lapse high-magniication AFM images of purple membranes on the
borders between the crystal and non-crystal areas. The bR molecules encircled by the
red dotted line indicate newly bound bR trimer (a), dimer (b) and monomer (c). The
white triangles indicate the previously bound trimers. Scale bars: 5 nm (a), 10 nm
(b, c). Imaging rate: (a) 0.3 s/frame, (b), (c) 0.1 s/frame.


Search WWH ::

Custom Search