Biology Reference
In-Depth Information
(a)
(b)
(c)
(d)
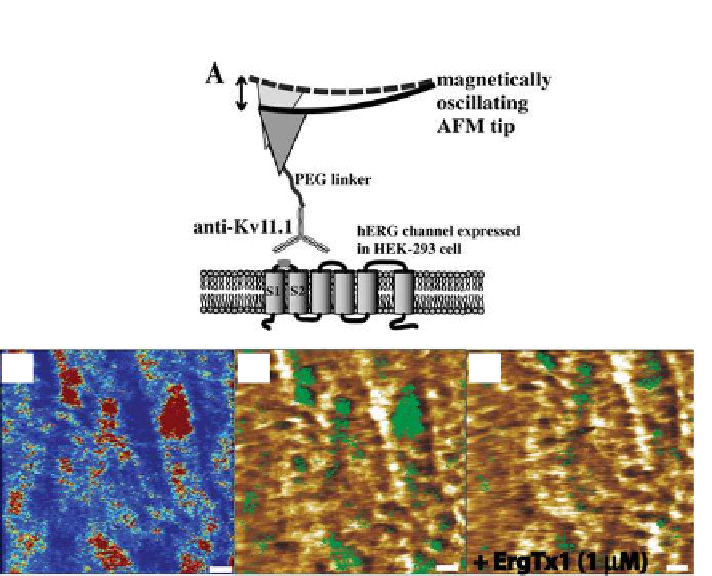
Figure 7.7.
Nano-mapping of hERG K
+
channels on hERG HEK-293 cell surface. (a)
Schematic representation of recognition imaging to detect hERG K
+
channels (here
binding sites of extracellular epitope [
] situated between S1 and
S2 domains of hERG subunit). (b) Recognition map obtained with anti-Kv11.1-
coated tip. (c) Superimposition of recognition map (
in green
) onto the corresponding
topography image. (d) Recognition clusters disappeared only in part in the presence
of high concentrations of ErgTx1 (~1 μM), whereas no visible effect was obtained at
lower concentrations of ErgTx1 (~400 nM) (data not shown). Scale bars on all images
are 170 nm.
43
shown in light grey
Therefore, AFM functional dynamic imaging (TREC) has been applied to
test the presence of extracellular binding sites of hERG K
+
channels on gently
ixed HEK-293 cells expressing hERG channels. Measurements were started
by scanning the whole cell surface with subsequent zooming into small areas
of ~4 μm
. TREC images were acquired with magnetically coated AFM tips
(MAC tips) which were functionalized with an antibody anti-Kv11.1 (against
epitope tags present on the hERG subunits) via PEG linker as previously
oscillation amplitude was adjusted to be less than the extended PEG linker to
provide the proper recognition image with high eficiencies and repeatability
(>90%). Accordingly, the recognition map represents an amplitude reduction
due to speciic binding between anti-Kv11.1 on the tip and epitope tags on
the cell surface (“dark” spots in
Fig. 7.7b
)
.
Figure 7.7c
illustrates non-uniform
2


Search WWH ::

Custom Search