Biology Reference
In-Depth Information
(a)
(b)
(c)
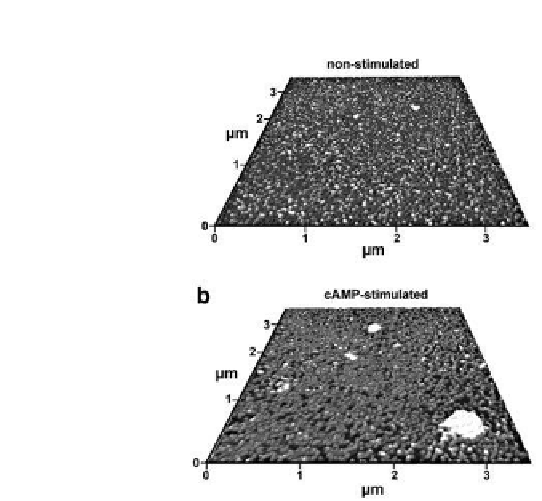
Figure 6.3.
(a) The membrane patch shown in
Fig. 6.3a
was isolated before cAMP
stimulation. (b) The membrane shown in
Fig. 6.3b
was isolated during cAMP
stimulation. The proteins exhibit heights from 6 nm to 20 nm. The large white spots
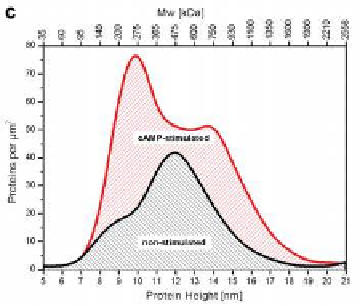
are yet unidentiied intracellular structures like yolk proteins. (c) Protein distribution
of CFTR-expressing plasma membrane. The hatched areas represent the respective
height distributions of stimulated and non-stimulated oocytes.
4
CFTR-expressing oocytes show an average protein height of 12 nm,
area). Stimulation with cAMP dramatically changes protein distribution. In
membranes of CFTR-expressing oocytes, the protein density increases in
response to IBMX from 200 to 400 proteins per μm
2
, with an average protein
height of 11.8 nm, corresponding to a molecular mass of 464 kDa. Protein


Search WWH ::

Custom Search