Information Technology Reference
In-Depth Information
Figure 12.19
Accounts
receivable
database
Databases
Applications
Customer
database
Inventory
database
Supplier
database
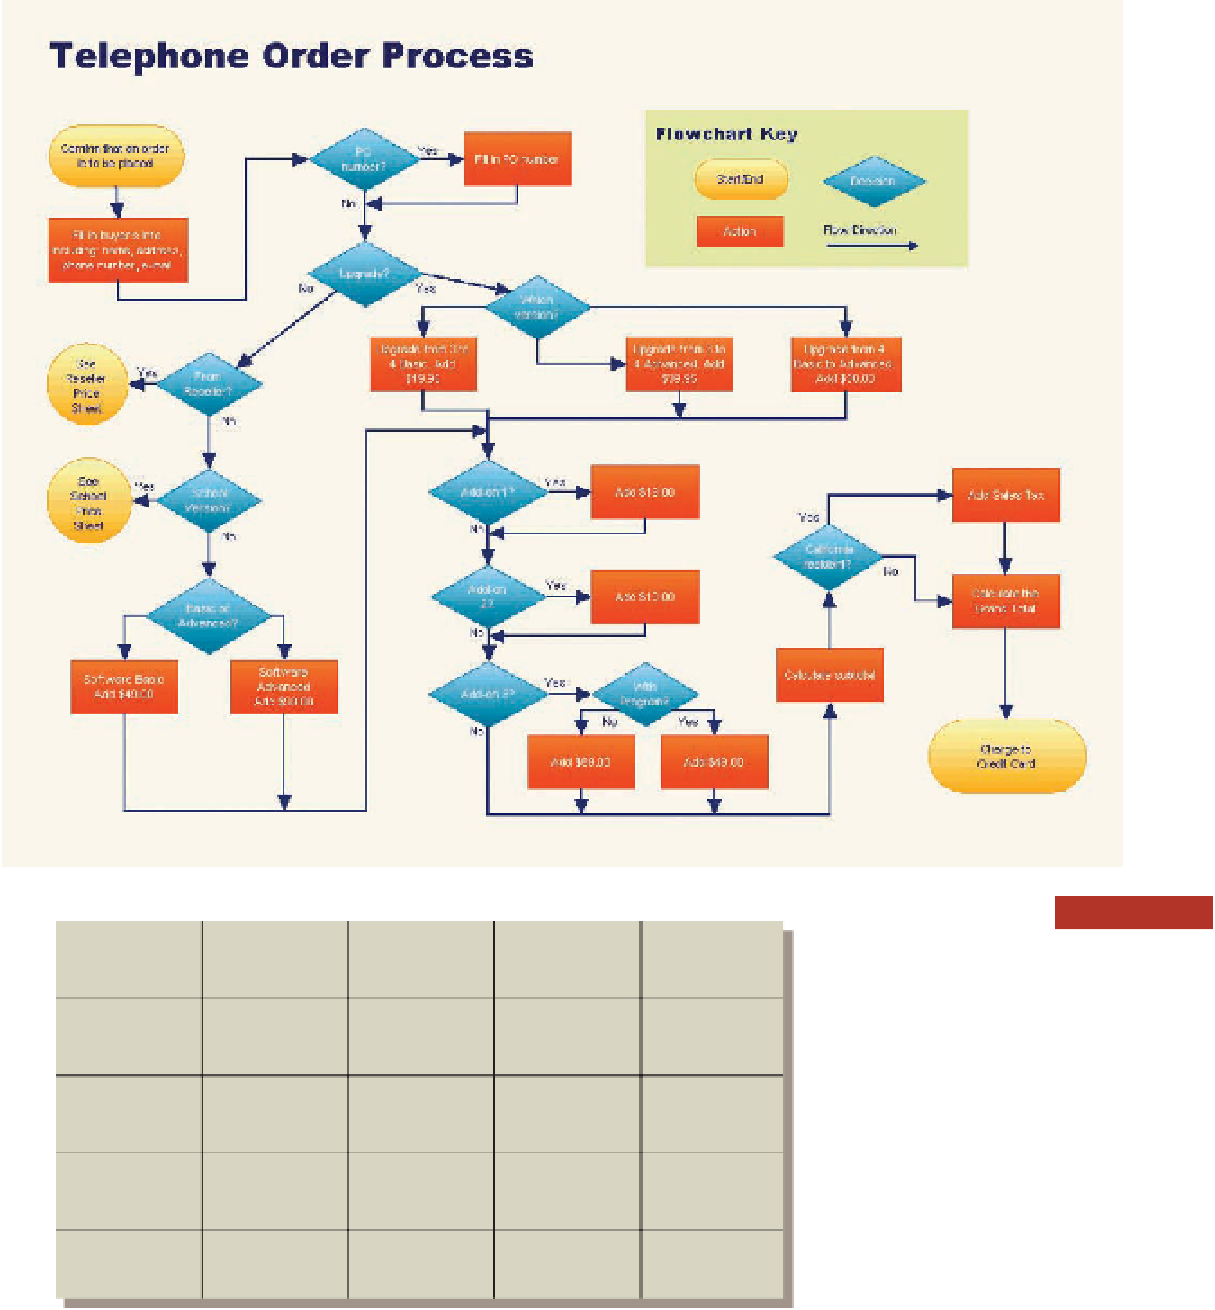
A Telephone Order Process
Application Flowchart
The flowchart shows the
relationships among various
processes.
(Source: Courtesy of
SmartDraw.com.)
Order
processing
application
Inventory
control
application
Marketing
analysis
application
X
X
X
X
Figure 12.20
X
X
A Grid Chart
The chart shows the relationships
among applications and databases.
Invoicing
application
X
X
CASE Tools
As discussed earlier, many systems development projects use CASE tools to complete
analysis tasks. Most computer-aided software engineering tools have generalized graphics
programs that can generate a variety of diagrams and figures. Entity-relationship diagrams,
data-flow diagrams, application flowcharts, and other diagrams can be developed using
CASE graphics programs to help describe the existing system. During the analysis phase, a
CASE repository
—a database of system descriptions, parameters, and objectives—will be
developed.
CASE repository
A database of system descriptions,
parameters, and objectives.