Information Technology Reference
In-Depth Information
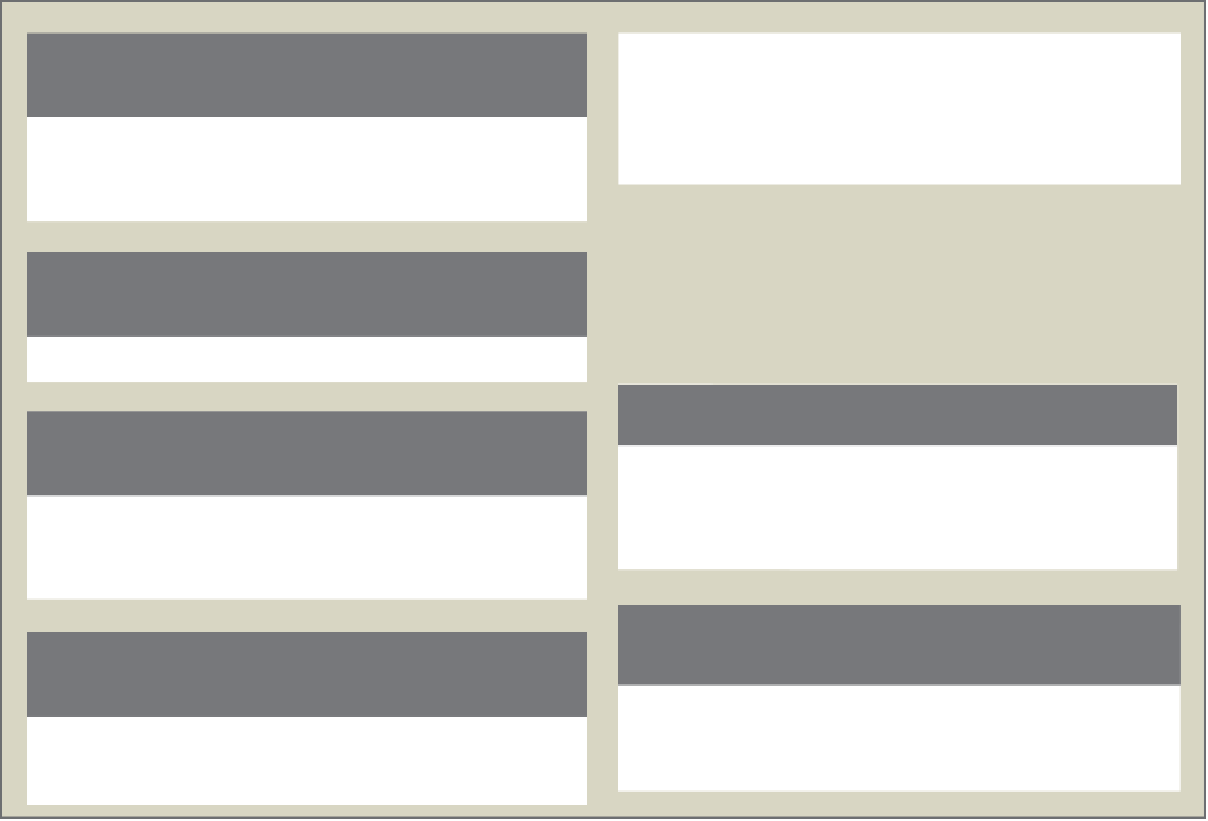
Management reports can come from various company databases, data warehouses, and
other sources. These reports include scheduled reports, key-indicator reports, demand re-
ports, exception reports, and drill-down reports (see Figure 10.6).
(a) Scheduled Report
(e) First-Level Drill-Down Report
Daily Sales Detail Report
Earnings by Quarter (Millions)
Actual
$12.6
$10.8
$14.3
$12.8
Prepared: 08/10/08
Forecast
Variance
Order
#
Customer
ID
Salesperson
ID
Planned
Ship Date
Quantity
Item #
Amount
2nd Qtr.
2008
$11.8
$10.7
$14.5
$13.3
6.8%
0.9%
-1.4%
-3.8%
P12453
P12453
P12454
P12455
P12456
.........
C89321
C89321
C03214
C52313
C34123
.........
CAR
CAR
GWA
SAK
JMW
..........
08/12/08
08/12/08
08/13/08
08/12/08
08/13/08
............
144
288
12
24
144
.......
P1234
P3214
P4902
P4012
P3214
.......
$3,214
$5,660
$1,224
$2,448
$720
.......
1st Qtr.
2008
4th Qtr.
2008
3rd Qtr.
2008
(f) Second-Level Drill-Down Report
(b) Key-Indicator Report
Sales and Expenses (Millions)
Daily Sales Key-Indicator Report
Qtr: 2nd Qtr. 2008
Actual
$110.9
$ 98.3
$ 12.6
Forecast
Variance
Gross Sales
Expenses
Profit
$108.3
$ 96.5
$ 11.8
2.4%
1.9%
6.8%
This
Month
Last
Month
Last
Year
Total Orders Month to Date
Forecasted Sales for the Month
$1,694
$2,224
$1,914
$2,608
$1,808
$2,406
(g) Third-Level Drill-Down Report
(c) Demand Report
Sales by Division (Millions)
Daily Sales by Salesperson Summary Report
Qtr: 2nd Qtr. 2008
Actual
Forecast
Variance
Prepared: 08/10/08
Beauty Care
Health Care
$ 34.5
$ 30.0
$ 22.8
$ 12.1
$ 11.5
$110.9
$ 33.9
$ 28.0
$ 23.0
$ 12.5
$ 10.9
$108.3
1.8%
7.1%
-0.9%
-3.2%
5.5%
2.4%
Amount
Salesperson ID
Soap
Snacks
CAR
GWA
SAK
JWN
..........
..........
$42,345
$38,950
$22,100
$12,350
..........
..........
Electronics
Total
(h) Fourth-Level Drill-Down Report
(d) Exception Report
Sales by Product Category (Millions)
Daily Sales Exception Report—Orders Over $10,000
Qtr: 2nd Qtr. 2008
Division: Health Care
Prepared: 08/10/08
Actual
Forecast
Variance
Order
#
Customer
ID
Salesperson
ID
Planned
Ship Date
Toothpaste
Mouthwash
Over-the-Counter Drugs
Skin Care Products
Total
$12.4
$ 8.6
$ 5.8
$ 3.2
$30.0
$10.5
18.1%
-2.3%
9.4%
-5.9%
7.1%
Quantity
Item #
Amount
$ 8.8
$ 5.3
$ 3.4
P12345
P22153
P23023
.........
.........
C89321
C00453
C32832
.........
.........
GWA
CAR
JMN
..........
..........
08/12/08
08/12/08
08/11/08
............
............
576
288
144
.......
.......
P1234
P2314
P2323
.......
.......
$12,856
$28,800
$14,400
..........
..........
$28.0
Figure 10.6
Scheduled Reports
Scheduled reports
are produced periodically, or on a schedule, such as daily, weekly, or
monthly. For example, a production manager could use a weekly summary report that lists
total payroll costs to monitor and control labor and job costs. A manufacturing report gen-
erated once per day to monitor the production of a new item is another example of a scheduled
report. Other scheduled reports can help managers control customer credit, performance of
sales representatives, inventory levels, and more.
A
key-indicator report
summarizes the previous day's critical activities and is typically
available at the beginning of each workday. These reports can summarize inventory levels,
production activity, sales volume, and the like. Key-indicator reports are used by managers
and executives to take quick, corrective action on significant aspects of the business.
Reports Generated by an MIS
The types of reports are (a)
scheduled, (b) key indicator, (c)
demand, (d) exception, and (e-h)
drill down.
(Source: George W. Reynolds,
Information Systems for Managers,
Third Edition. St. Paul, MN: West
Publishing Co., 1995.)
Demand Reports
Demand reports
are developed to provide certain information upon request. In other words,
these reports are produced on demand. Like other reports discussed in this section, they often
come from an organization's database system. For example, an executive might want to know
the production status of a particular item—a demand report can be generated to provide the
requested information by querying the company's database. Suppliers and customers can also
use demand reports. FedEx, for example, provides demand reports on its Web site to allow
customers to track packages from their source to their final destination. Other examples of
demand reports include reports requested by executives to show the hours worked by a
particular employee, total sales to date for a product, and so on. Many companies are putting
scheduled report
A report produced periodically, or on
a schedule, such as daily, weekly, or
monthly.
key-indicator report
A summary of the previous day's
critical activities; typically available
at the beginning of each workday.
demand report
A report developed to give certain
information at someone's request.