Graphics Reference
In-Depth Information
Table P2-1
: Process of Visualization
Step
Example
Description
Data
(Chapter
3)
Collect and clean the data. Then
prepare it for use as a graph data
set with explicit nodes and edges
and associated attributes for
each. For example, for e-mail
data, this involves creating nodes
and edges out of To, From, and
Cc fields.
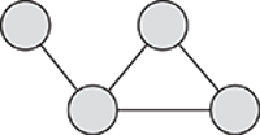
Layout
(Chapter
4)
Review statistics and arrange the
nodes and edges in a way that
reveals insightful patterns such as
components, clusters, and so on.
Many different kinds of layouts
are possible. For example, in an
e-mail graph, this may mean
identifying nodes that act as
bridges between different groups
of people.