Graphics Reference
In-Depth Information
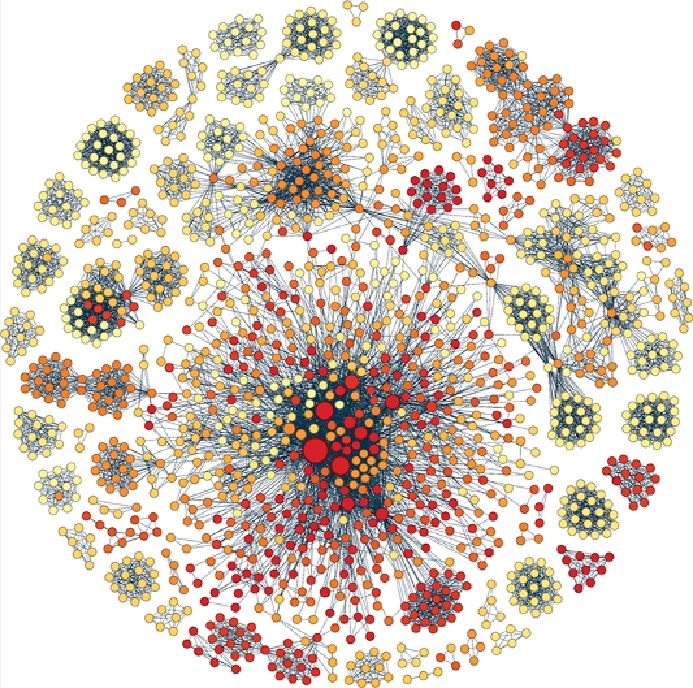
Figure P2-1
: Graph of people connected through 10,000 e-mail messages
Whether you are exploring e-mails, tweets, market baskets, Internet
networks, flight networks, or global trade flows, you usually follow a
sequence of steps, as well as use various tools, to transform data into
insights through analysis and visualizations.
Process
Table P2-1
provides an overview of the next six chapters. Chapter 3
(“Data—Collect, Clean, and Connect”), Chapter 4 (“Stats and Layout”),