Graphics Reference
In-Depth Information
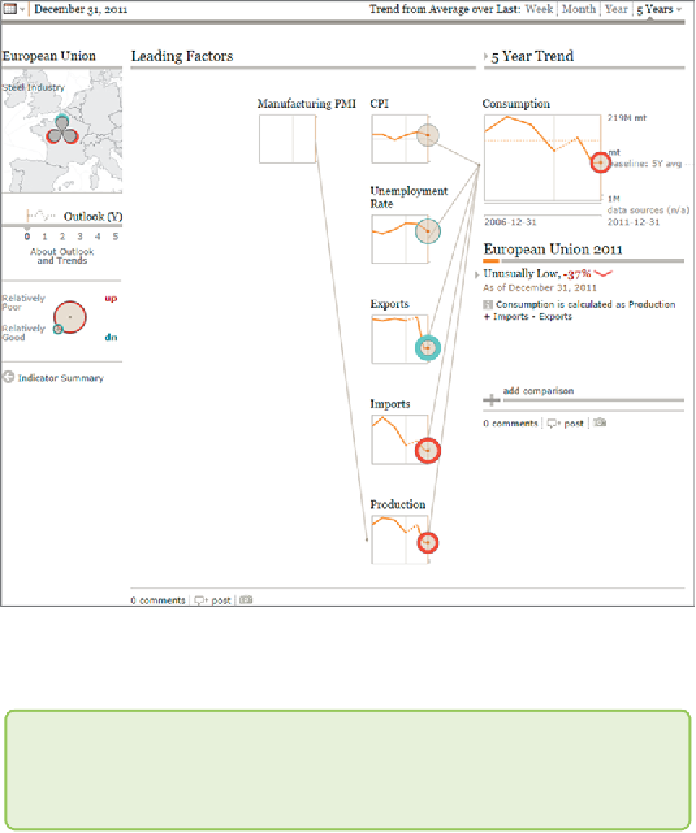
Figure 2-14:
A behavioral factor tree shows the effects of modeled
influencing factors in an outcome through correlation of pattern and
inflection.
Note
Chapter 12, “Flows,” provides detailed examples of the use of graphs for
flow analysis, including a case study using this data.