Graphics Reference
In-Depth Information
direction across the whole graph. The left-to-right layout of nodes in the
decision tree makes it easy to see flow is left to right.
The same principle applies to graph problems that are not trees.
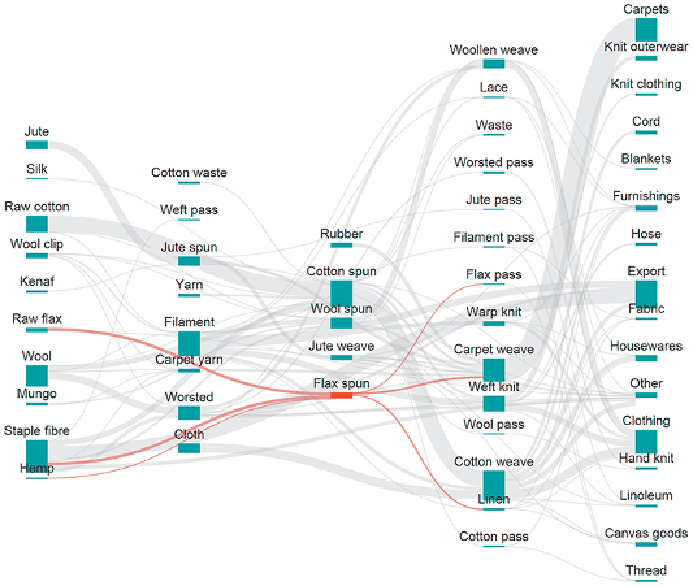
Figure
2-11
shows a complex supply chain of materials for the textile industry. This
visualization technique is known as a
Sankey diagram
. In this technique,
flow always enters the same side of each node and exits on the other. Width
indicates the volume of flow.
Figure 2-11:
Sankey diagrams are an ideal graph technique for showing
flow. Here, flow of materials in textile production is shown, where width
indicates volume.
Sankeydiagramscanalsobeusedtoshowpathsofcustomerexperience.For
example,
Figure 2-12
shows flow through website pages. In this case, each
column in the diagram represents a step in those paths, with the exception