Graphics Reference
In-Depth Information
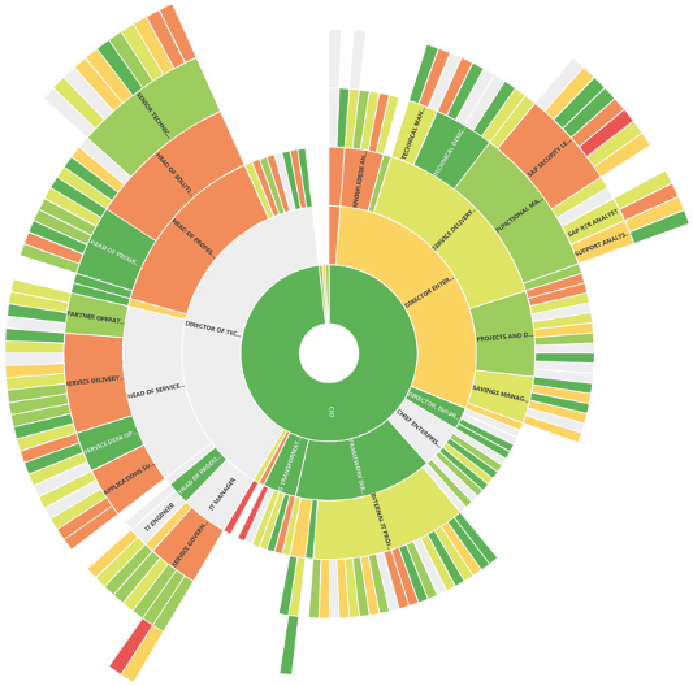
Figure 2-6:
A sunburst chart provides an alternate representation of
hierarchy appropriate for viewing organizational subdivisions by
proportion of the whole. Profit and loss are shown in degrees of green and
red, revealing roots of overall corporate performance.
Used with permission. All rights reserved by OrgVue.
Org charts can lend more clarity to the qualitative aspects of a tree, whereas
sunburst charts tend to lend more clarity to quantitative aspects. Both are
ideal choices for representing hierarchies.