Graphics Reference
In-Depth Information
occur and provides a way to see an entire series of events, enabling an
analyst to understand the whole story.
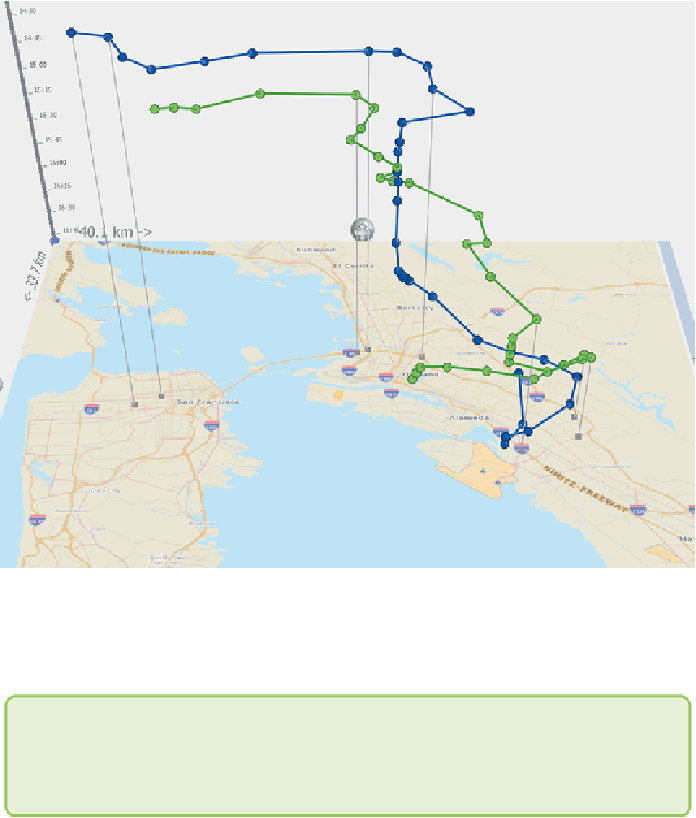
Figure 15-16:
Using a third dimension allows movements and events to be
expressed in time, telling the whole story. Unlike in the previous 2-D
example, visualizing taxi routes here in 3-D using GeoTime shows a
meeting could not have occurred anywhere but in Oakland.
Note
You can find information about GeoTime and additional examples at
Visualization of behaviors may be complemented by computational pattern
finding. Both Influent and GeoTime include capabilities for matching
patterns of activity.
Figure 15-17
shows a simple example of how you can