Graphics Reference
In-Depth Information
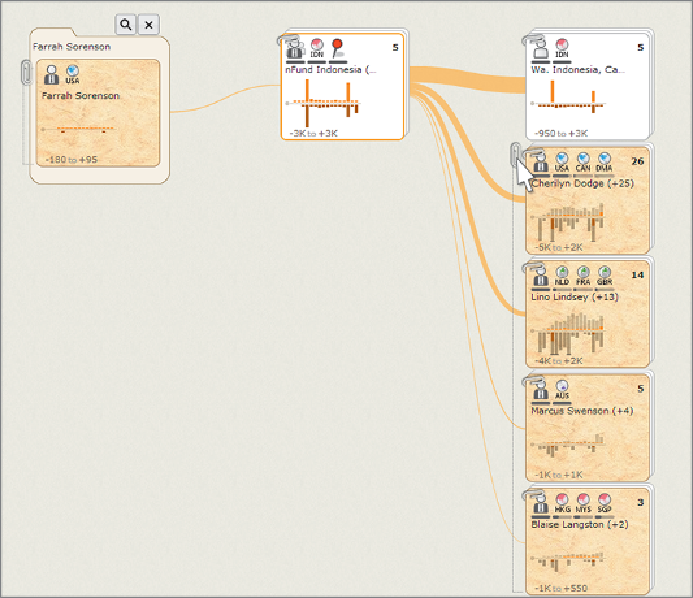
Figure 15-14:
Clustering is hierarchical. Unstacking using the paper clip
reveals the next level down in the hierarchy. In this case, accounts are
clustered by type, then by geography at several levels, and eventually by
name. Clustering occurs on each level of expansion until a manageable
number of accounts exist for viewing.
Time series charts and selective use of icons chosen to suit a particular data
set provide compact summary visualization of key account characteristics.
Tailored ensemble clustering provides scalability and allows for a much
richer representation of nodes in large numbers than a single-colored dot
pernode. Aggregating nodes and links, aswellasusing aleft-to-right layout,
ensures that the visualization does not turn into an indecipherable hairball.
Richrepresentationsanddrill-downcapabilitiesensurethatvaluabledetails
are not lost through aggregation.