Graphics Reference
In-Depth Information
Note
Although the loans that each lender in the demo contributes to are
based on real data, the individual transactions of lenders are
simulations only, and participants have been anonymized.
The workflow in Influent starts similarly to that of the graph database
example in Chapter 14, with one or more focal nodes of interest. Like Titan,
Influent supports Lucene-backed free text or criteria-based search, in this
case using Solr. A graph node in Influent is an account, represented by a
card. In the example shown in
Figure 15-8
,
Farrah Sorenson is the initial
node of interest, found by a search.
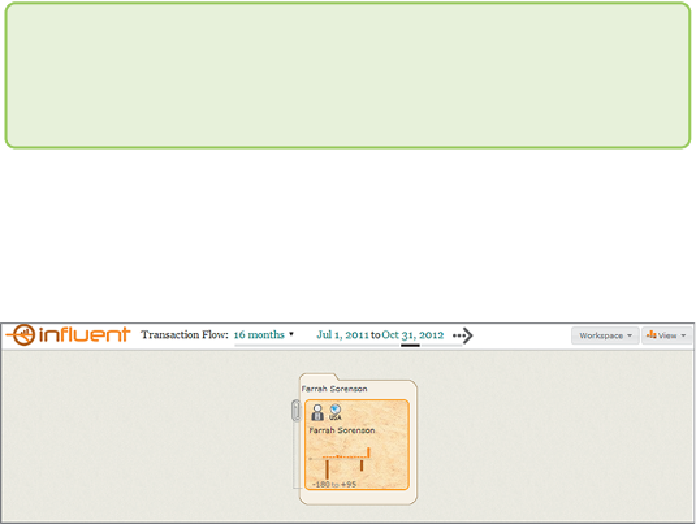
Figure 15-8:
In Influent, a card represents an account showing key
attributes using icons, and activity over the selected time period using a
time series chart. Bars above and below indicate incoming and outgoing
transactions.
The card for Farrah Sorenson's account shows that she is a lender (indicated
by the icon of a person in a business suit), and that she lives in the United
States (indicated by the geographic icon). Icons in Influent are selected
for each application or data set to represent the most important summary
attributes of an account holder.
Farrah's account activity from July 1, 2011, to October 31, 2012, is
represented by a time series chart. Bars above the middle line indicate the
pattern of deposits into her account each month, and bars below indicate
withdrawals. As you might expect, the money loaned by Farrah exits her
account in lump sums (indicated by the two longer bars on the bottom),
and repayments enter her account in smaller increments at regular monthly