Graphics Reference
In-Depth Information
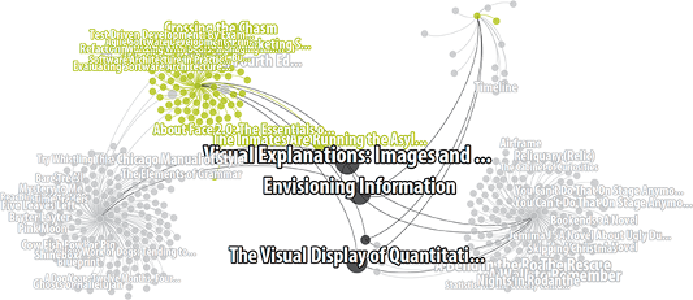
Figure 15-6:
Using color, you can also highlight new nodes, while old
nodes are faded out. Here, new co-referenced products predominantly
about software are shown in green, and carry-over products are shown in
black.
Community Evolution
So far, the examples in this chapter have provided evidence of how fixed
layouts are ideal for understanding graph change. You can use color to
understand how communities change by gaining and losing members over
time. But what if, instead of seeing change to communities, you want to
see change
of
communities? Communities in this chapter's examples so far
take form through layout, which is computed across all time. In some data
sets, however, community structure may change dramatically in that span.
New communities may form, and old ones break apart. In certain cases,
it is valuable to compare communities in the current state of the graph to
communities from another state.
Comparing community structures requires a different visual approach.
Often, you can use layout alone (if the graph does not resolve into a hairball)
or layout reinforced with color to visualize communities. To compare
community structure, however, one of layout and color should depict the
same structure in both views, while the other is applied independently to
each. Fixing layout and coloring independently for computed communities
in each view is one of the options. But a more effective choice is to compute
communities for one of the views, map it to color in both views, and let both
views lay out naturally to express community structure in each.