Graphics Reference
In-Depth Information
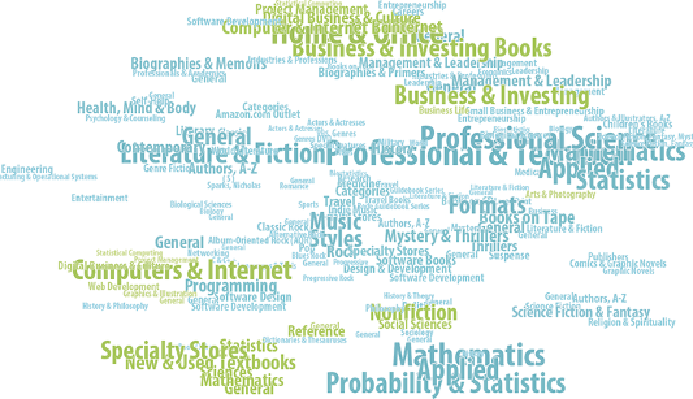
Figure 14-7:
Filtering categories and mapping size to the number of
products in each forms a topic word cloud reflective of related consumer
interests surrounding
Envisioning Information.
Categorizations of the
book itself are highlighted in green, highlighting the fact that although it is
surprisingly filed under business management categories, it is not filed
under the statistics-related categories that many related topics are.
Plotting Network Activity
The dominant type of analysis in very large graphs is to branch outward
from focus nodes of interest and to analyze properties of the resulting
subgraph. However, sometimes you may find it useful to analyze the graph
as a whole. Physical networks are one such case. Chapter 13, “Spatial
Networks,” provided an example of ship routes, where plotting all of the
data reveals an informative picture of all traffic. This approach can be useful
for simple graph structures as well.
Figure 14-8
shows how plotting a very large graph of brain data using
Aperture Tiles reveals hot paths of activity. A multi-level tiled approach
achieves exploratory scalability in a similar way to Google Maps. Aperture
Tiles provides a framework for computing tile-based analytics using the
Apache Spark engine for large-scale data processing and, similar to Titan,
can be run locally on a Hadoop cluster to scale.