Graphics Reference
In-Depth Information
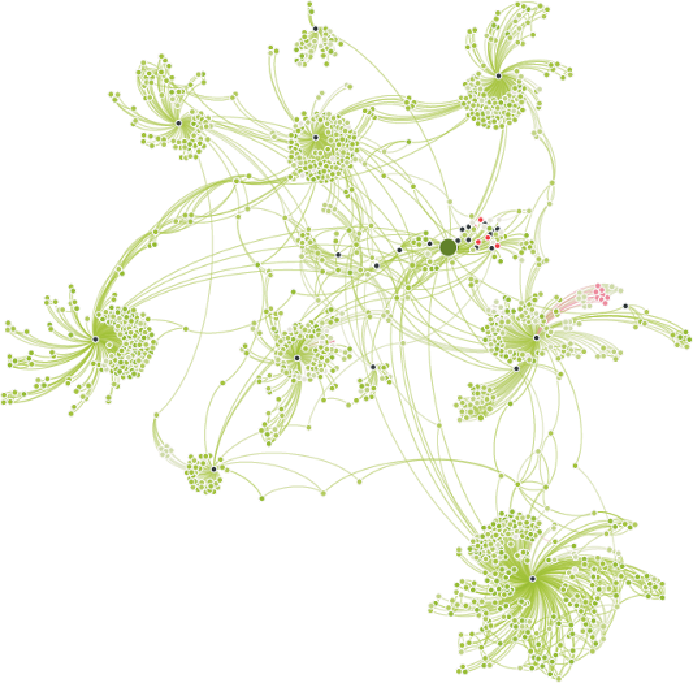
Figure 14-4:
Mapping color from customer ratings here reveals little
correlation with clusters of interest, except that products with exceptionally
poor reviews at the red end of the spectrum tend to be clustered together.
Color alone is enough to observe some overall patterns in the data, but it is
difficult to get a sense of the character of clusters of interest.
Turn on node labels and map them from product titles. More than 1,000
titles makes for a lot of words, so a little work is required for them to
be useful. Ideally, the most important titles would be featured in various
clusters, and the others would be small enough not to obscure the structure
of the graph. Run the Eigenvector Centrality statistic on the nodes in the