Graphics Reference
In-Depth Information
events, and potential collaborators—symptomatic of a more organized
attack. Also, different kinds of attacks have different visual signatures that
stand out when viewing the patterns in a particular time period.
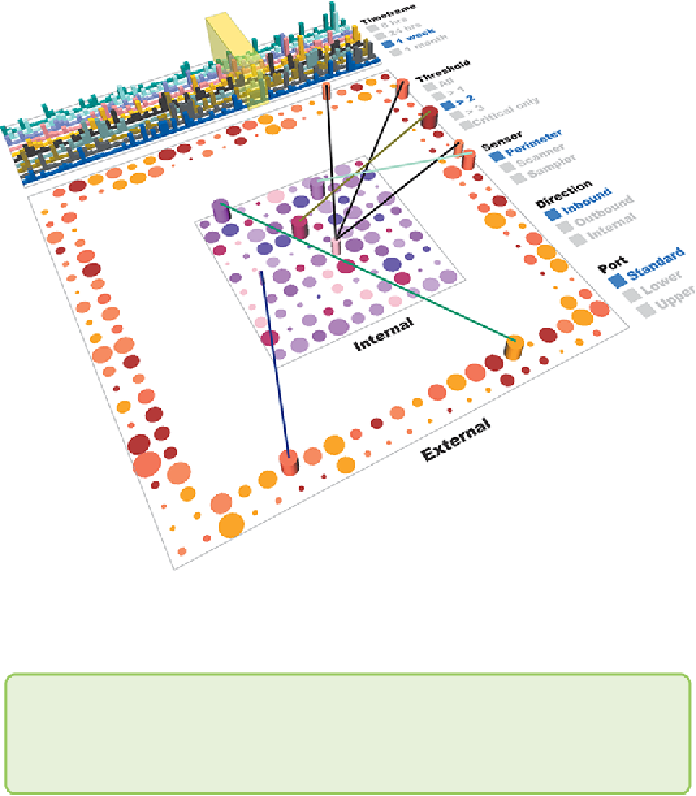
Figure 1-9:
This graph visualization shows potential anomalies with
connections between internal computers (inside) and external computers
(around perimeter).
Note
Chapter 4, “Stats and Layout,” discusses in detail the visual layout of a
network.
Visualizing connections and patterns of connections may be useful for
spotting risk, such as different types of threats to a physical network as
shown here, as well as other types of risk, such as financial counterparty