Graphics Reference
In-Depth Information
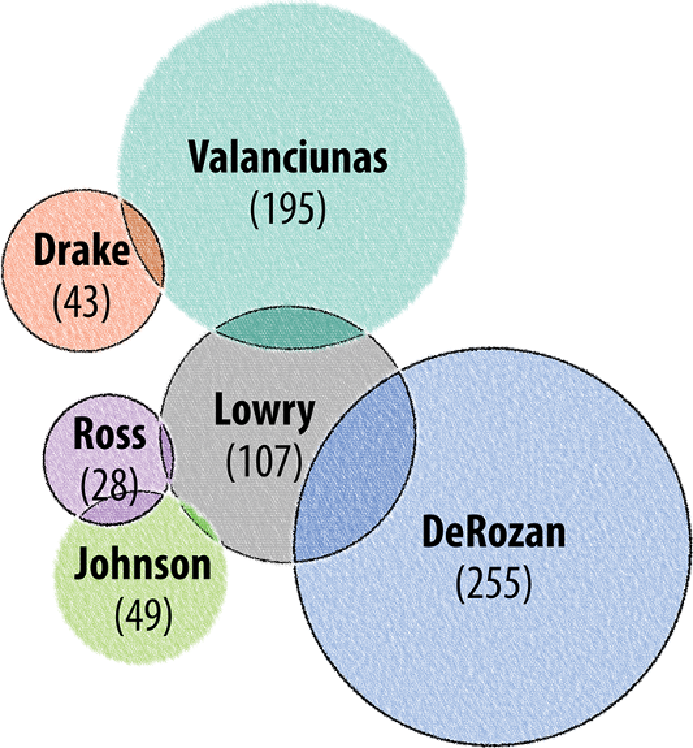
Figure 11-19:
Venn diagrams provide an intuitive high-level expression of
size and overlap for a small number of communities. Here, the Cytoscape
Venn plug-in was used to organize fans by topic mentions.
Summary
This chapter has looked at a relatively small sample of Toronto Raptors
social media data containing about 1,600 people and 15,000 links.