Graphics Reference
In-Depth Information
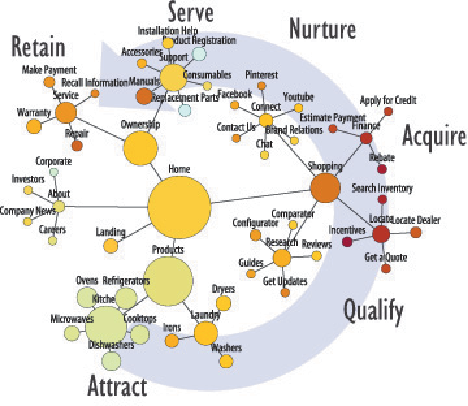
progressive stages of a relationship from initial courtship through to a loyal
customer using ongoing services. In the tree shown in
Figure 10-13
, you can
see the customer life cycle as an idealized counterclockwise flow.
Figure 10-13:
This website tree also shows a counterclockwise customer
life cycle.
To analyze the life cycle, you can filter aggregate flows for specific regions
of the site. In this case, the edge data has additional columns that indicate
if a particular edge belongs to a particular step. You can also tag flows to
differentiateforwardflowsfrombackwardflows—theassumptionbeingthat
building a relationship involves forward flows through the life cycle, while
backward flows may indicate problems with the relationship or problems
with the website that make it difficult for prospective customers to follow
the planned sequence. Again, some effort is involved with creating filters
to remove all the edges that are not of interest and to set up all the visual
attributes.
Figure 10-14
shows the all the flows to the Research section of the site, with
backward flows indicated by arrows.