Graphics Reference
In-Depth Information
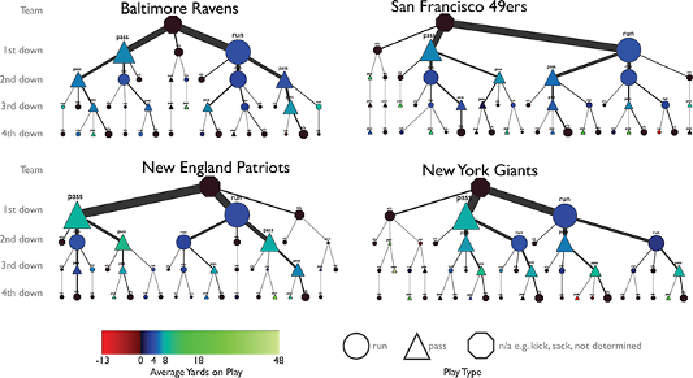
Figure 10-10:
Pass or run decision trees for 2011 NFL conference final
teams help users discern any patterns.
Lookingonlyatthefirstdown,youcanseethatBaltimoreandSanFrancisco
both tended to run a bit more than pass, whereas the opposite is true for
New England and New York. Also, the first-down pass for New England and
New York both tend to be a brighter cyan color than the passes for BAL
and SF, indicating that the New England and New York teams gain more
yards on average than do Baltimore and San Francisco for a first-down pass.
At this first level, you can determine that New England and New York are
strong passing teams.
Comparing the next level splits takes a bit more visual effort. Looking at San
Francisco, for example, while first down is split with a slight bias toward
runs, at the next level, the sizes of triangles and circles is fairly similar, again
with a slight bias toward runs.
Looking at Baltimore, on the other hand, you can see a different pattern.
On the first down, Baltimore tends to run. But on the second down, all the
second-down triangles tend to be bigger than the corresponding run circles.
This leads to the observation that Baltimore uses more runs for the first
down and more passes for the second down.