Graphics Reference
In-Depth Information
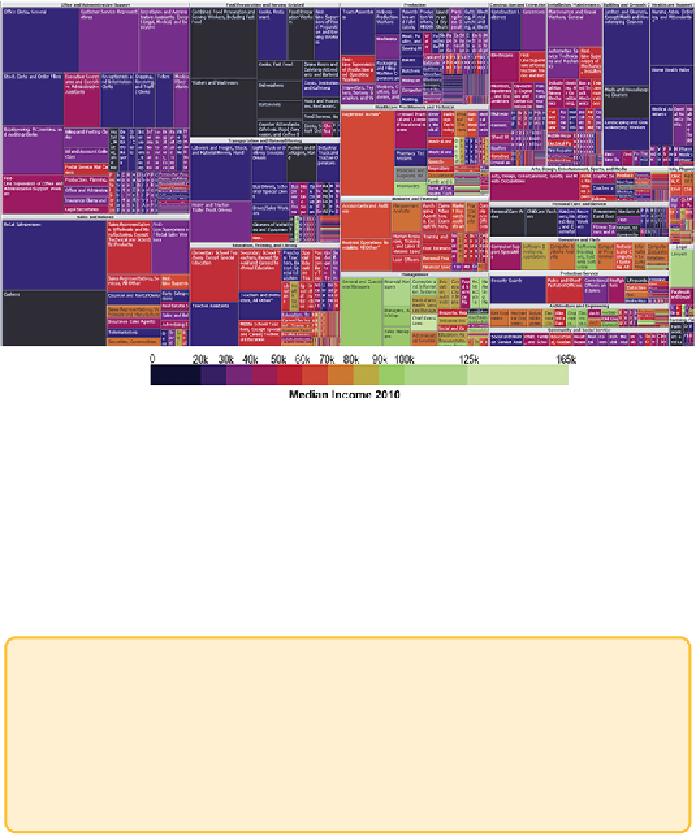
(earning $20,000 or less per year) to light green (earning more than
$125,000 or more per year).
Figure 10-7:
This treemap shows occupations in the United States with
size indicating number of people employed, and color indicating income.
The treemap makes it very apparent which occupations have the most
people (for example, retail salespersons, near the lower left) and regions of
high income (for example, management, a set of rectangles near the middle
bottom, mostly green). Food preparation (a group of rectangles near the
top left) is almost uniformly colored by low wages—despite the glamour
associated with food preparation on U.S. reality television shows.
Tip
Color encoding where the brightness consistently increases while the
hue slightly varies can provide more distinctly perceivable levels than
just varying brightness. This also orders the patterns perceptually so
that brighter colors always represent a higher numeric value than a
darker color.
A treemap can be very effective for displaying two variables by size and
color. However, some deficiencies may make it difficult to answer some