Graphics Reference
In-Depth Information
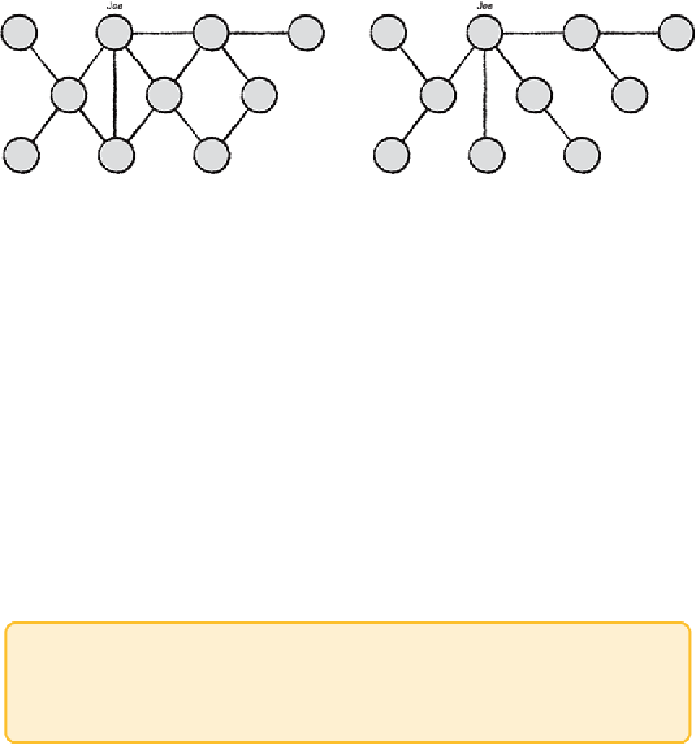
Figure 10-4:
On the left, you see a graph, and on the right, a spanning tree
of the same graph. In this spanning tree, only the links that connect a node
back to Joe on the shortest path remain.
Consider the graph shown earlier in this topic in Figure 9-10, which showed
movie actors connected to each other via movies in which they had acted.
The graph in Figure 9-10 had a single giant component with approximately
20,000 actors. The task was an analysis of a specific actor, Leonardo
DiCaprio, and his connections. This resulted in a smaller, but still highly
connected, graph.
Instead,youcouldcreateatreerepresentingalltheconnectionstoDiCaprio.
The first level of connection to him is his co-stars (or, in tree terminology,
the
children
ofDiCaprio).Thenextlevelshowspeoplewhohaveco-starred
in movies with these people not including DiCaprio or his co-stars, and so
on.Notethatifadifferentstarwasofinterest(say,ChristopherWalken),the
tree should be extracted again because the process described earlier creates
the optimal tree (that is, shortest paths) for the root actor.
Tip
Highly connected networks can be locally analyzed to a specific node by
extracting a tree.
Ideally, using a tool, you should be able to automatically extract the tree
from the graph. However, for this example, a spanning tree filter was not
found in the popular graph visualization toolkits, so a Python script was
created instead.
The script essentially starts with a single node of interest (for example,
Leonardo DiCaprio) and then walks through the entire list of links. If the
link contains Leonardo DiCaprio, then that node is added to the list of links
in the tree. If the link is a duplicate (that is, it includes DiCaprio and the