Graphics Reference
In-Depth Information
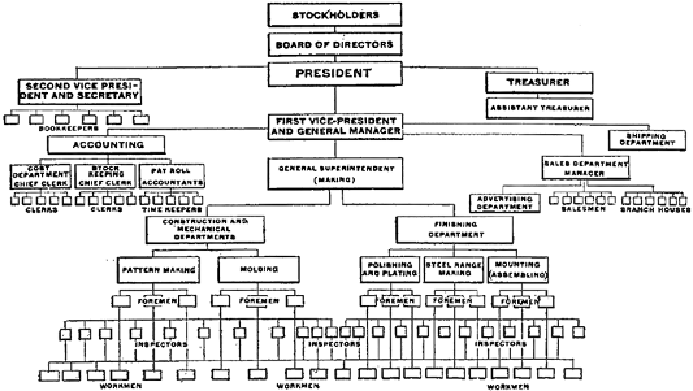
Figure 10-1:
This organizational chart is for a stove manufacturing
company from the 1910s. Image courtesy Prelinger Library
Source: Graphic Methods for Presenting Facts (New York: Engineering
Magazine Company, 1914), Willard Brinton Cope.
Organizational charts evolved from earlier genealogy charts. Some early
genealogy charts were beautifully illustrated and conveyed a wealth of
information beyond lineage. For example,
Figure 10-2
shows the genealogy
of French royalty in the fourteenth century as published in an 1820s
publication (courtesy of
www.davidrumsey.com
)
. For this chart, the
following conventions were used:
• Nodes indicate people, with black circles for men, diamonds for women,
and crowns for rulers.
• Italics indicate spouses.
• Icons indicate date of death.
• Diamond-shaped line styles indicate illegitimate offspring.
• Small caps indicate rulers, and all-caps denote distinct branches.
• Wider portions of the tree have unique background shading.