Graphics Reference
In-Depth Information
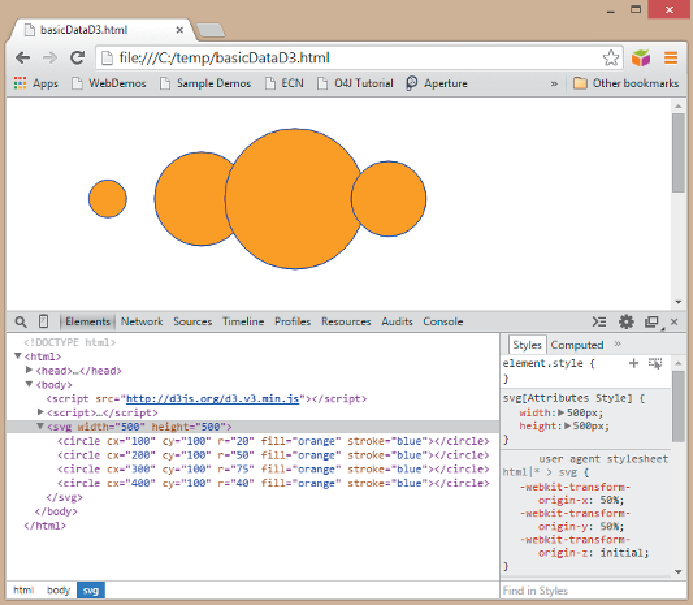
Figure 8-6:
By running the sample code, you can see D3 creating circles
based on data.
Where the circles partially overlap, you can see how each successive circle
is drawn on top of the previous circle. All the SVG is drawn in the sequence
listed. You should be aware of this sequence so later on when you draw a
graph, links are not drawn over the top of the nodes or labels drawn last.
D3 and Graphs
D3 is all about data visualization, and not simply graph visualization.
Examples provided with the library include non-graph visualizations such
as bar charts, scatterplots, and box plots, as well as general graph
visualizations such as node-link graphs, chord diagrams, and Sankey